October 2023 feature release
The October 2023 feature release is an update to v23.2 and includes many improvements to HH Data Management. Many of these were requested by you, so thanks for continuously sharing your feedback and ideas! As usual, if you have any questions or issues with the release please contact us using support@hh-dev.com.
Installation
This is a regular update to HH Data Management that is not a mandatory update. The software will auto-update like normal from the software.
User interface
Event subscription user interface
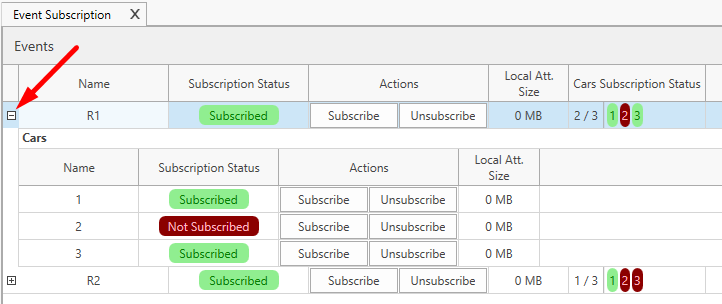
We have revisited the subscription page of the software that was often prone to mistake and confusion.
It should be a lot clearer now to see if a user is subscribed to an event and to a car in a specific event. Under the column "Cars Subscription status", the cars subscribed to are displayed in green.
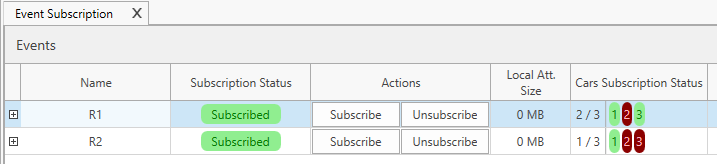
The car selection is done by expanding the event:
Track user interface
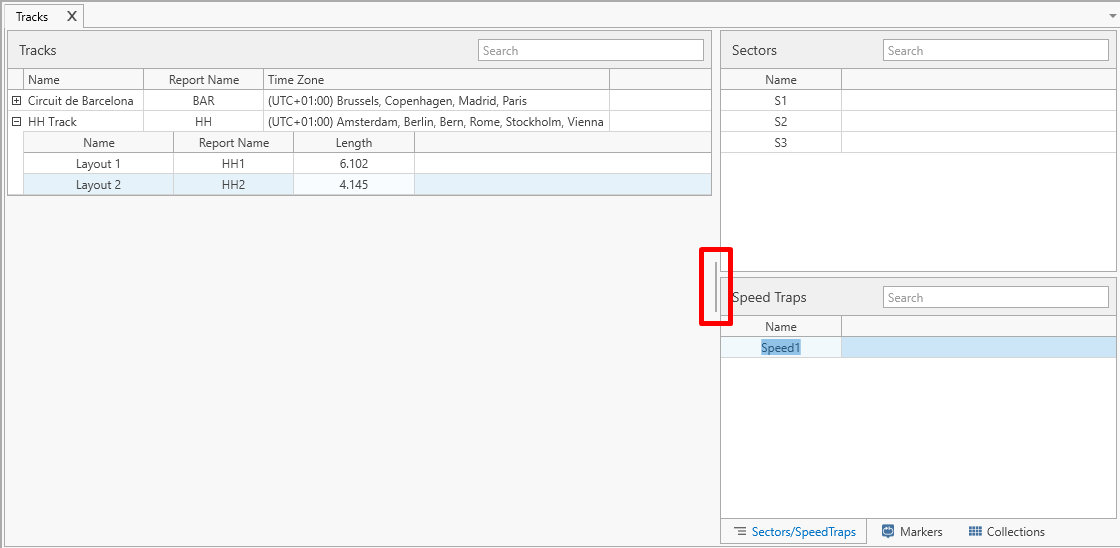
The track user interface was revisited to include a slider on the right side for the sectors, speed traps, lap markers and collections. This will help mainly on accounts with a lot of parameters stored on the track or the track configuration profiles.
Export profile
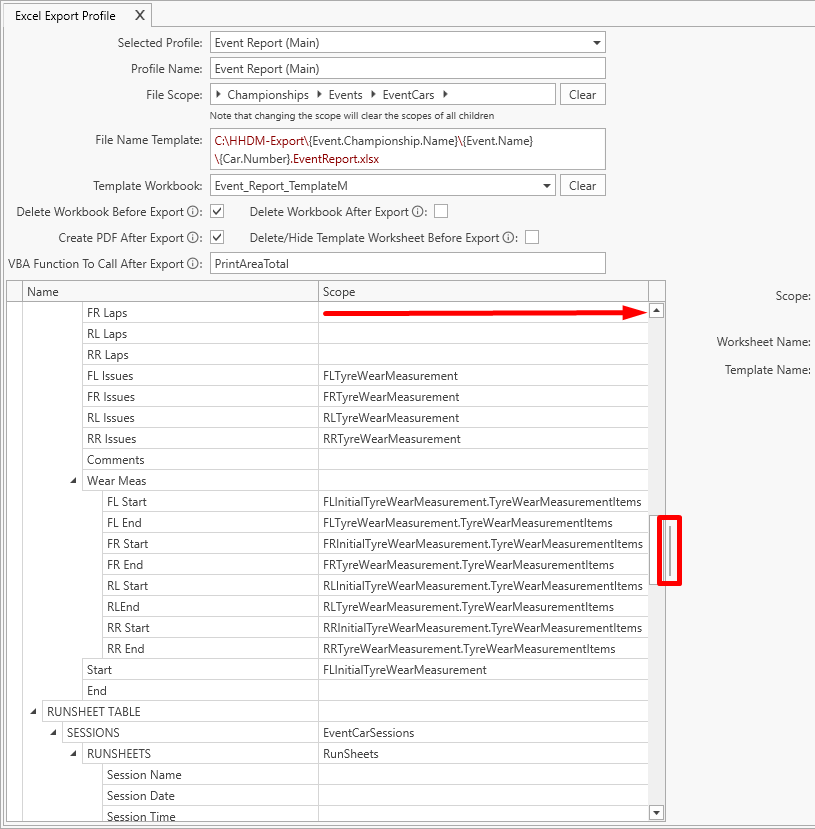
The user interface for all profile was quite limited in the past. We have re-worked it so each column can now be extended to facilitate working on those profiles. This was done with the help of a slider:
Main graph
Box plot
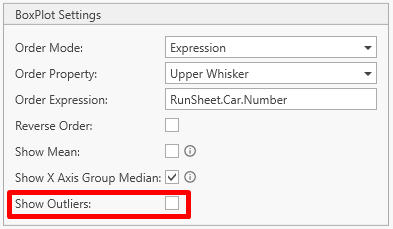
We have added a few options to the Box plot in the main graphs:

First of all the order of the box plots can be controlled. By default, the order is controlled by the median like it was done previously.
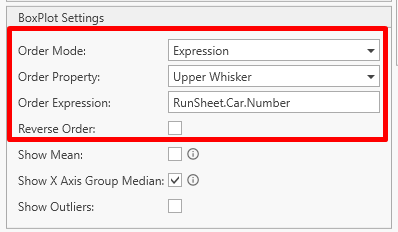
But now the order mode can be of two types:
- Box plot property
- Median
- Upper Whisker
- Lower Whisker
- Third Quartil
- Fist Quartil
- Expression
The expression option allows to always order by car number for example, or by driver name. So entities always show in the same order.
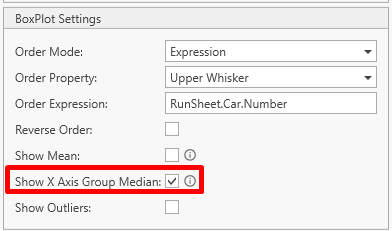
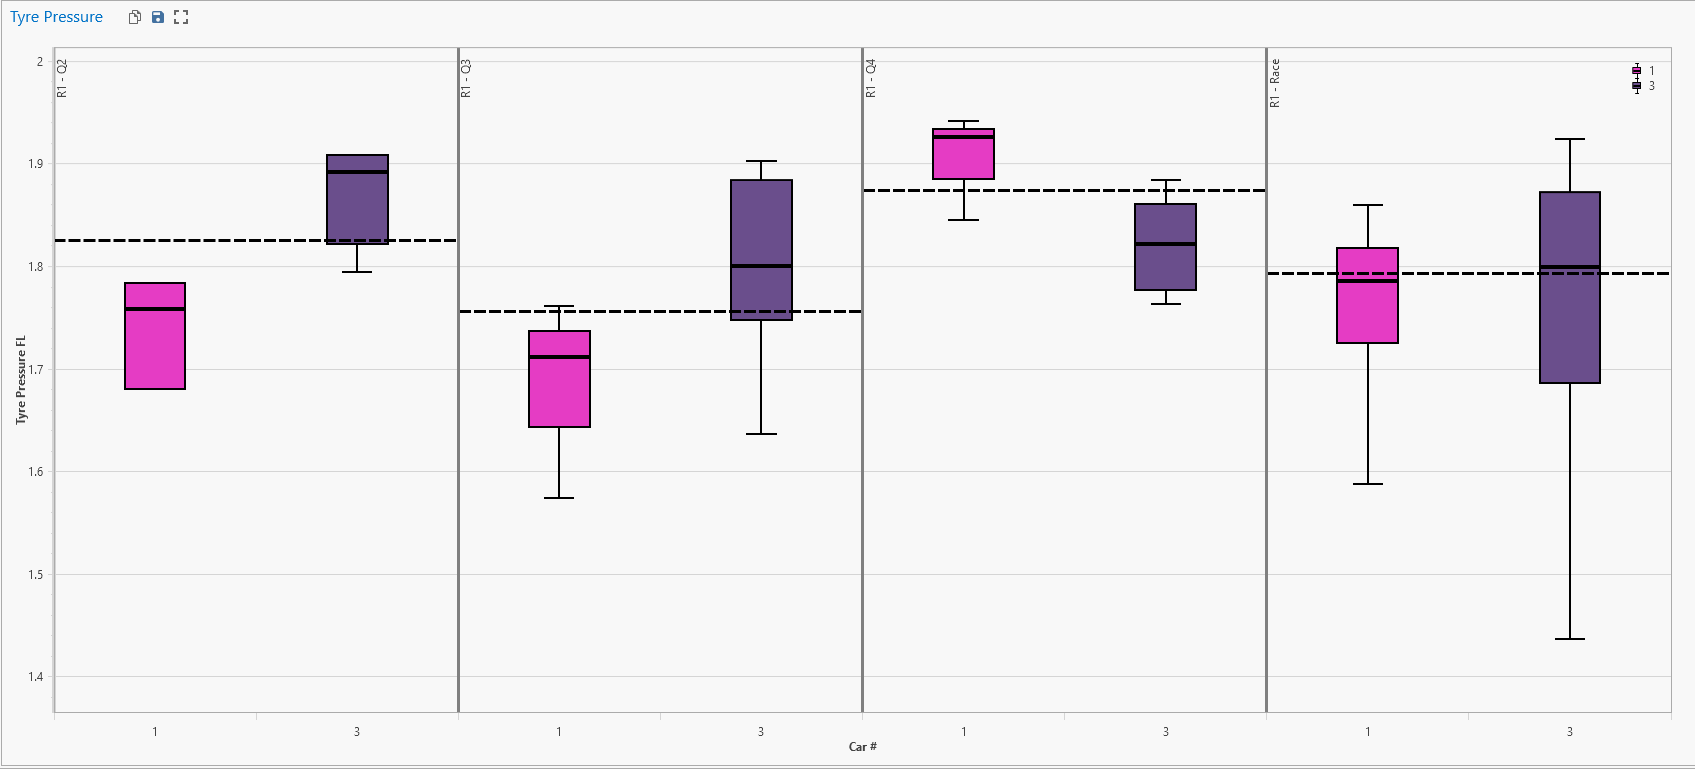
The "Show axis group median" option always to show for each x-axis scope a median of all box plots.
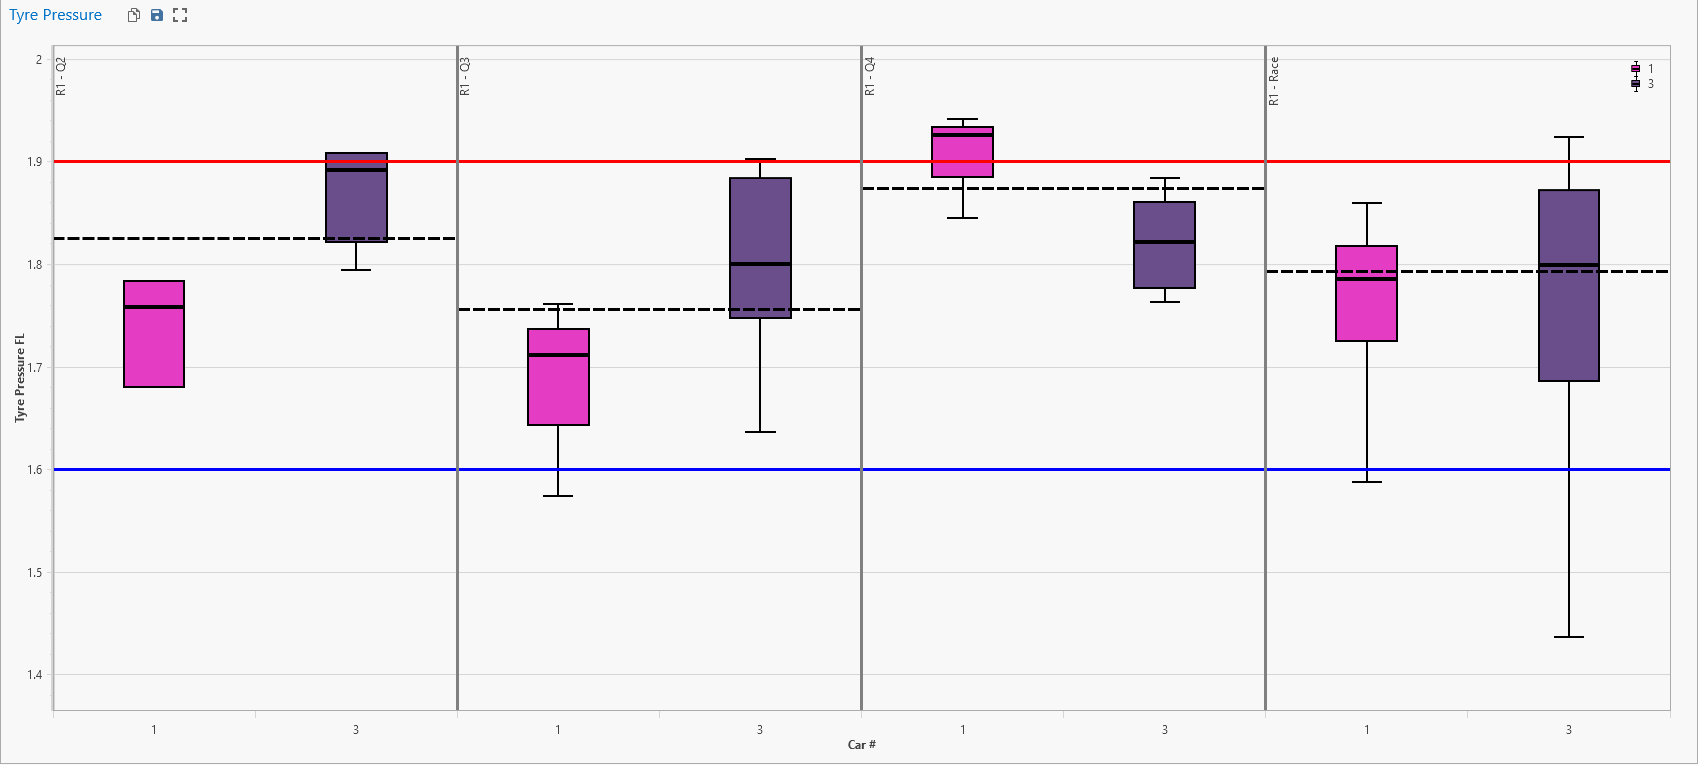
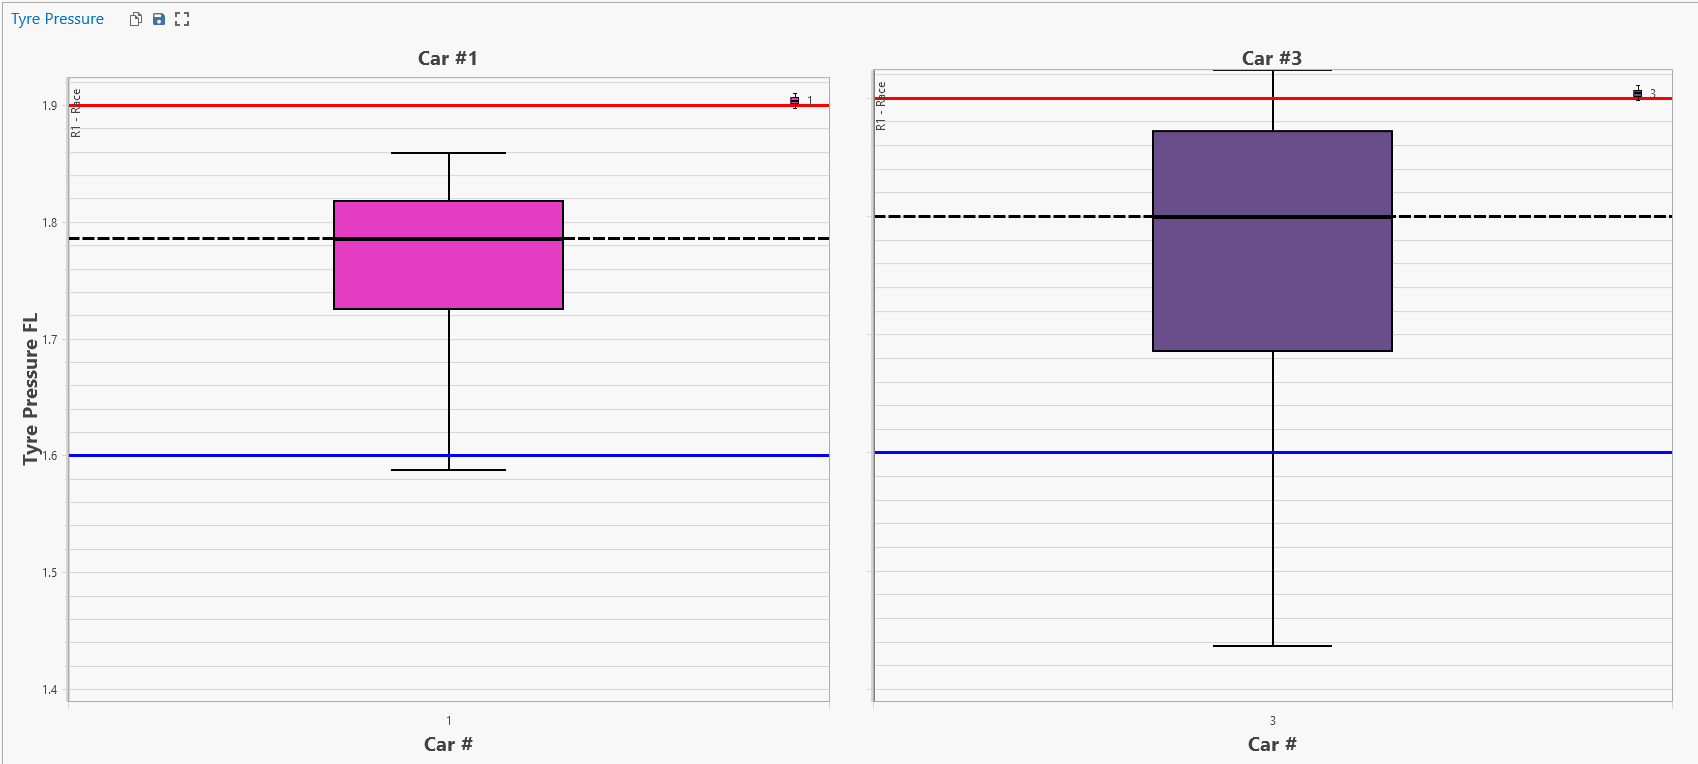
Here is an example of a front left tyre pressure graphs for 2 cars for multiple session:
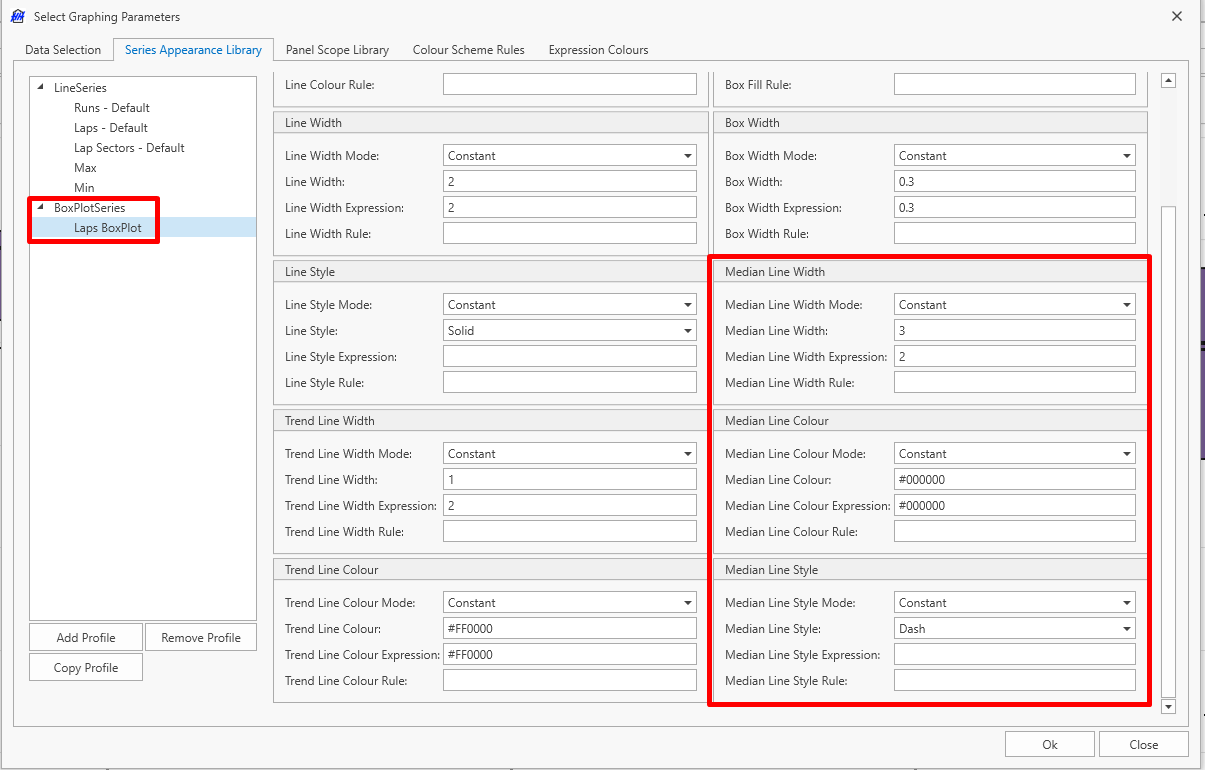
The median style can be controlled from the series appearance:
The last option is the ability to remove outliers from the graphs. This can be quite useful to auto-scale the graphs on the box plot only:
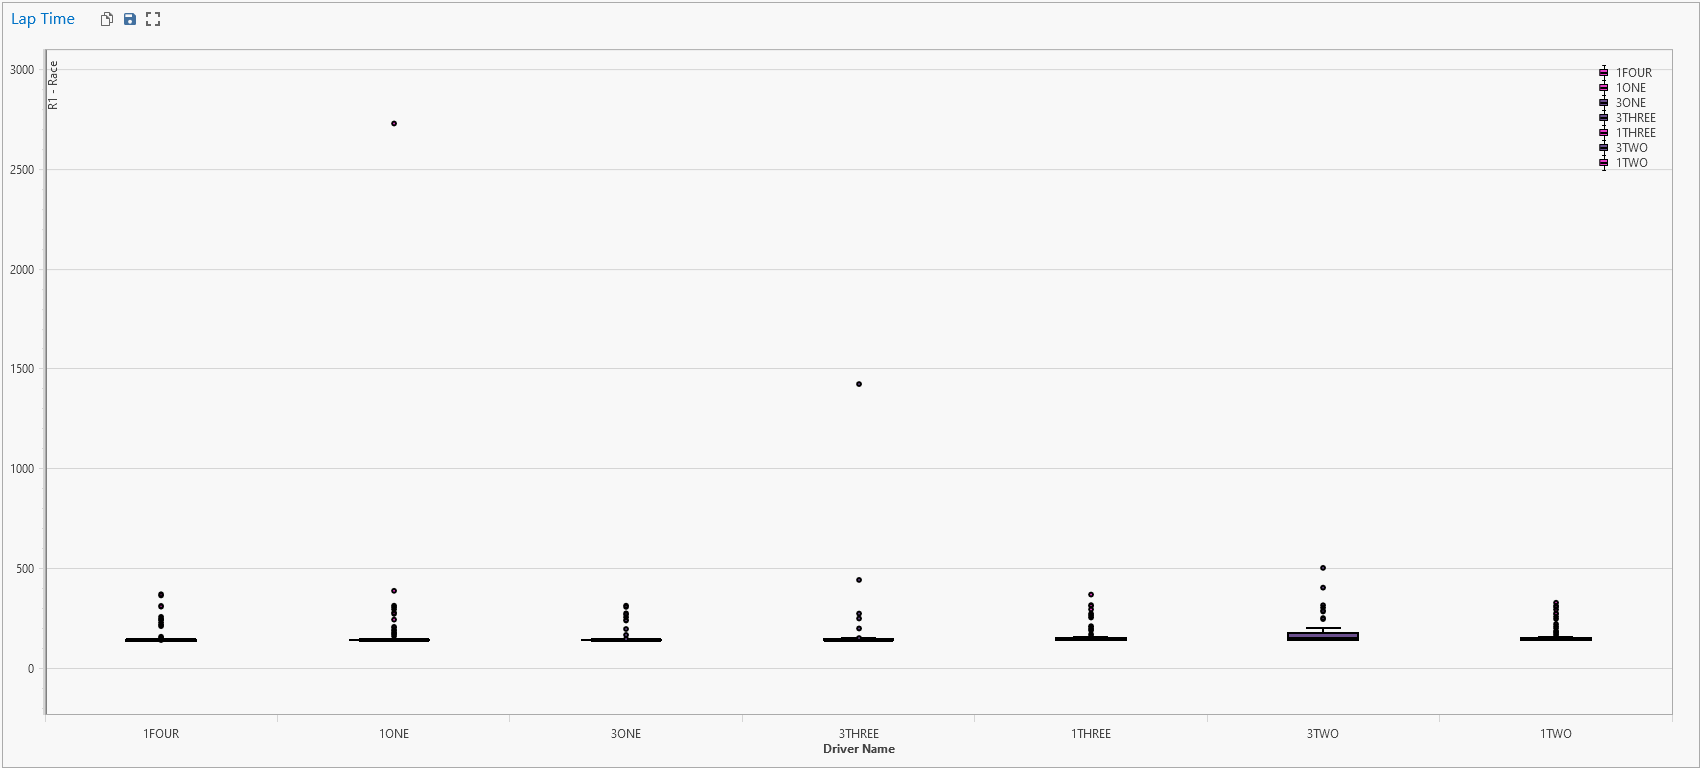
Here is an example with outliers of lap times for drivers from multiple cars:
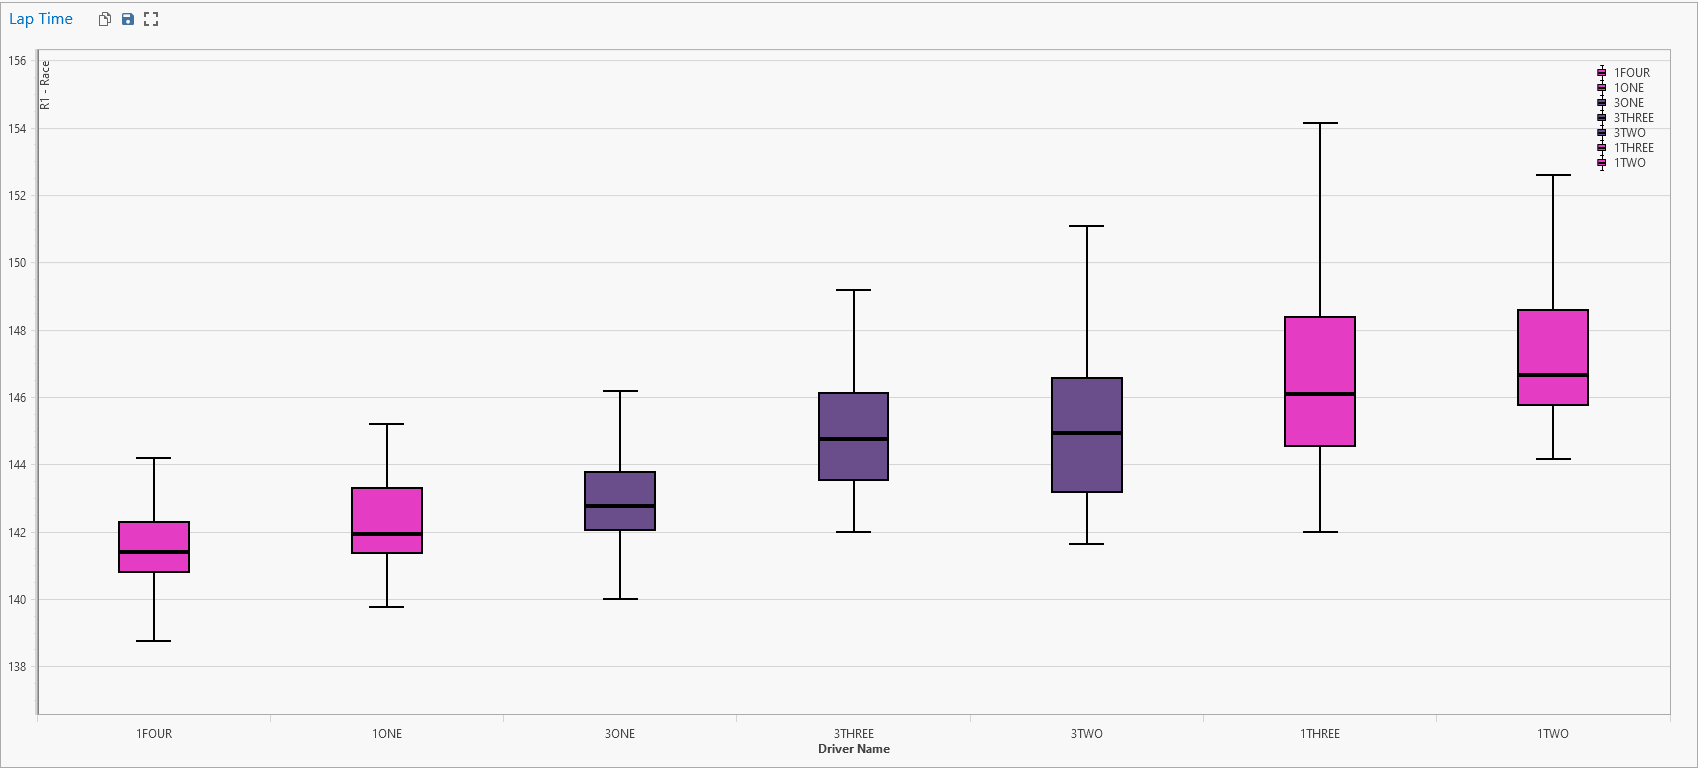
Without outliers:
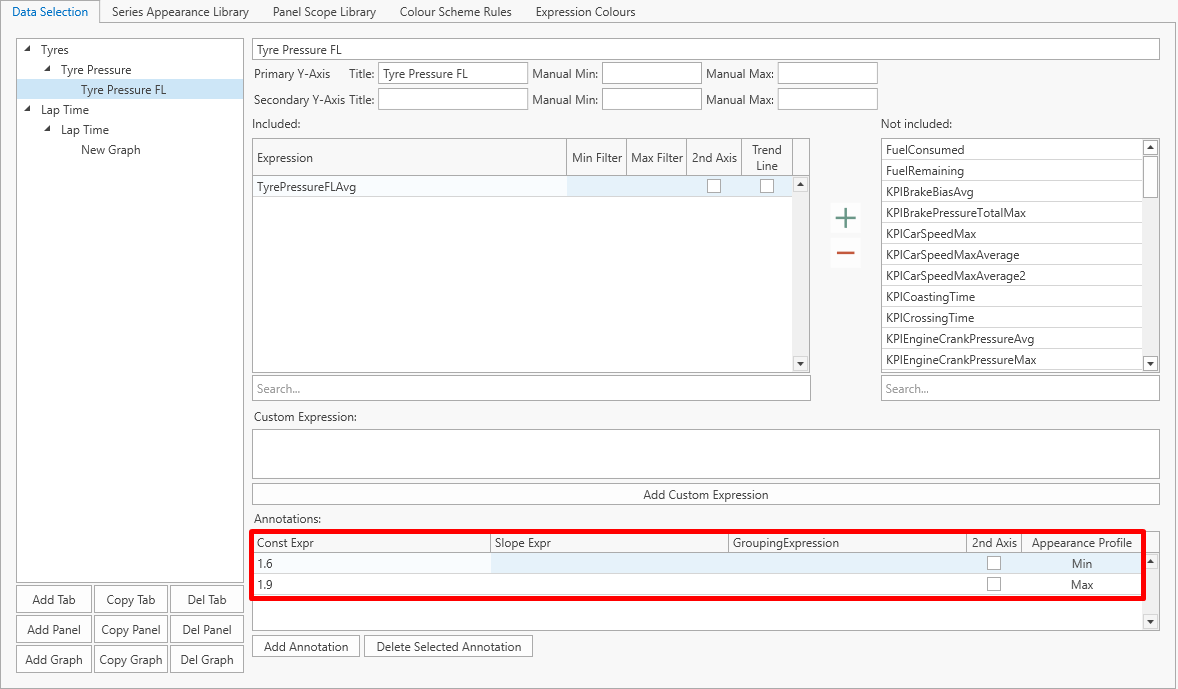
We have also added the ability to add annotations to box plot. Similar to what was available for a regular scatter plot.
Here is an example where we add minimum pressure and target pressure using the annotation:
Expressions for axis limit and filter
Previous to this version, only numerical values could be used to control axis min and max as well as any filter. Now, expressions can be used directly in the following cells:
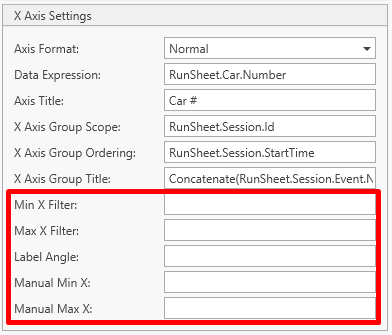
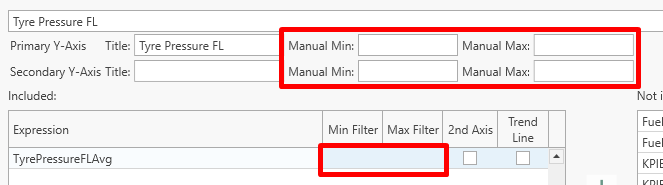
Any expressions that returns a numerical value can be used. Moving forward we will work on having IntelliSense available for all those input boxes.
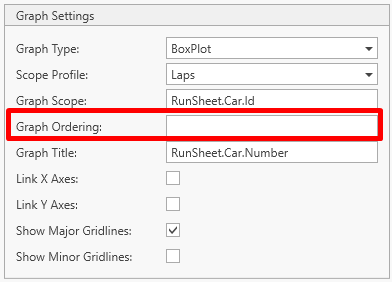
Graph scope ordering
Similar to the x-axis scope ordering, we have added a graph scope ordering.
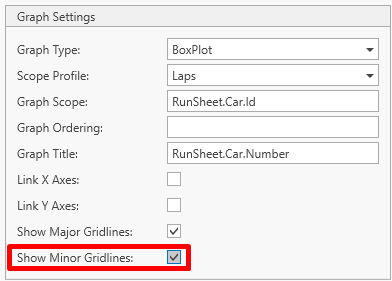
Minor gridlines
There is now an option to show the major and minor gridlines:
Excel export
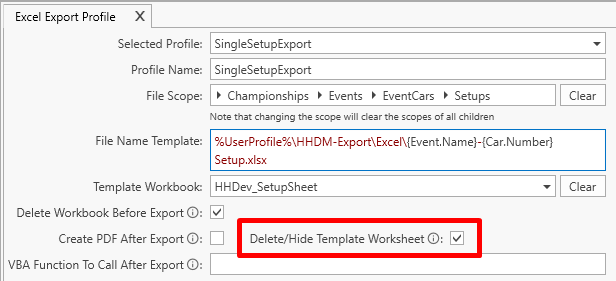
Delete/Hide template worksheet
A new option was added to delete or hide template worksheet following export:
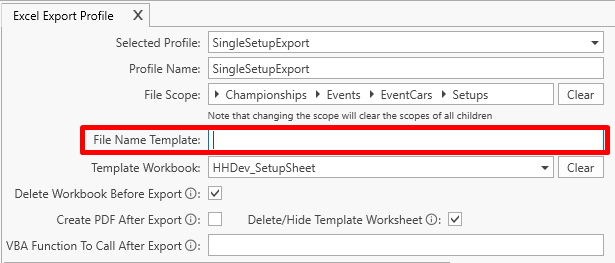
Select where to export file option
By default a file is exported based on the file name template. However if the file name template is left empty then the user will get prompted with a file selector window to choose the export location and the name of the file:
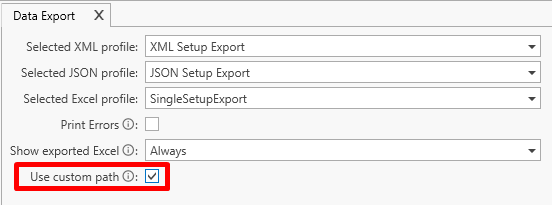
Options in Data Export
Two new options were added to the data export page for excel export:
- option to pick if an Excel file should be shown or not when exported
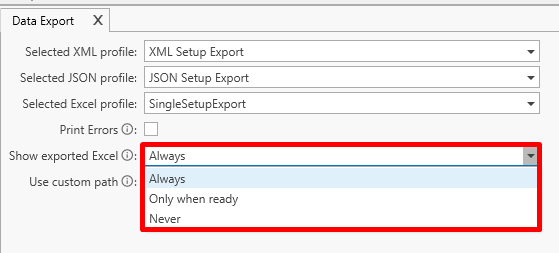
- use custom path - if checked this option will prompt the user with a file selector window to choose the export location and the name of the file.
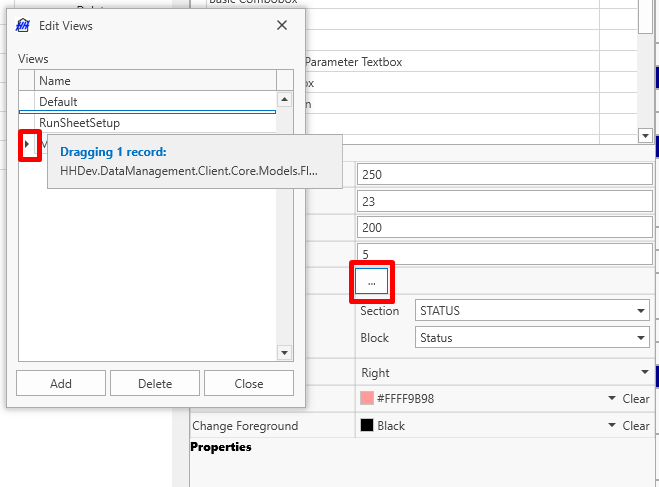
CID Editor
Ability to re-order the view order
We have added the ability to re-order views in the CID. This can be down from the CID Editor by dragging up and down the views:
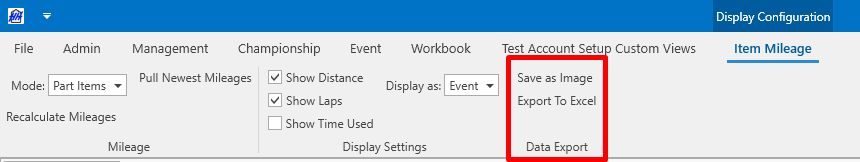
Mileage
Data export
We have added two options from the Item Mileage page:
- Save as Image that will export the pivot table as a png image
- Export to Excel
Miscellaneous
Auto populate display names
Display names are now auto populated based on the parameter name everywhere in the software:
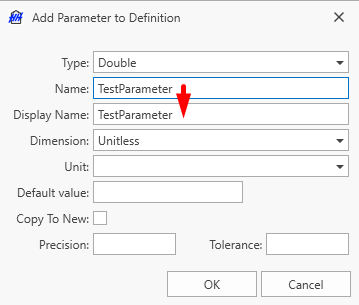
Display name can then be adjusted to be different than the name.
Image quality in CID
When displaying large image in a CID, the quality was quite poor in the past. Now the quality is not impaired.