· 7 min read

Version 24.2 includes many improvements to HH Data Management. Many of these were requested by you, so thanks for continuously sharing your feedback and ideas!
As usual, if you have any questions or issues with the release please contact us using support@hh-dev.com.

Installation

This major update brings changes to the database schema but this software will migrate the database automatically during its installation. Note that prior versions will not be allowed to sync anymore.

A resync of the database isn't needed and work on the account can resume immediately after the update.

caution

On the first start with this new version, the software will perform the database changes and it may take slightly longer than usual for the software to start.

info

A safe mode option has been added to HH Data Management for troubleshooting purposes.

Performance

As always performance improvements and reducing the memory consumption of the software has continued to be a focus of this release.

The biggest improvement has come from adding an option to compute math parameters on demand. In the future this will become a default setting but currently it is an opt-in option. Depending on the account (how many math parameters there are, how many are displayed in the UI and how many cars are in an event) we have seen improvements of up to 8x the speed of loading the caches when starting the software with a layout and memory consumption improvements of 4x. This feature works by only evaluating a math expression when it is needed (i.e. when the value needs to be shown on the screen). With the default behaviour all math parameters are evaluated when the caches are loaded.

Other general improvements to the math expressions have helped with performance and memory consumption but not to such a high degree as the ability to compute the math parameters on demand.

We have made some improvements to the cached expressions in the main graph which help with refresh performance on large layouts.

We have made some minor changes to improve the speed of the syncing - this would mainly be noticeable when subscribing to events with a large number of sync ops or doing an initial sync of an account.

Live run plan

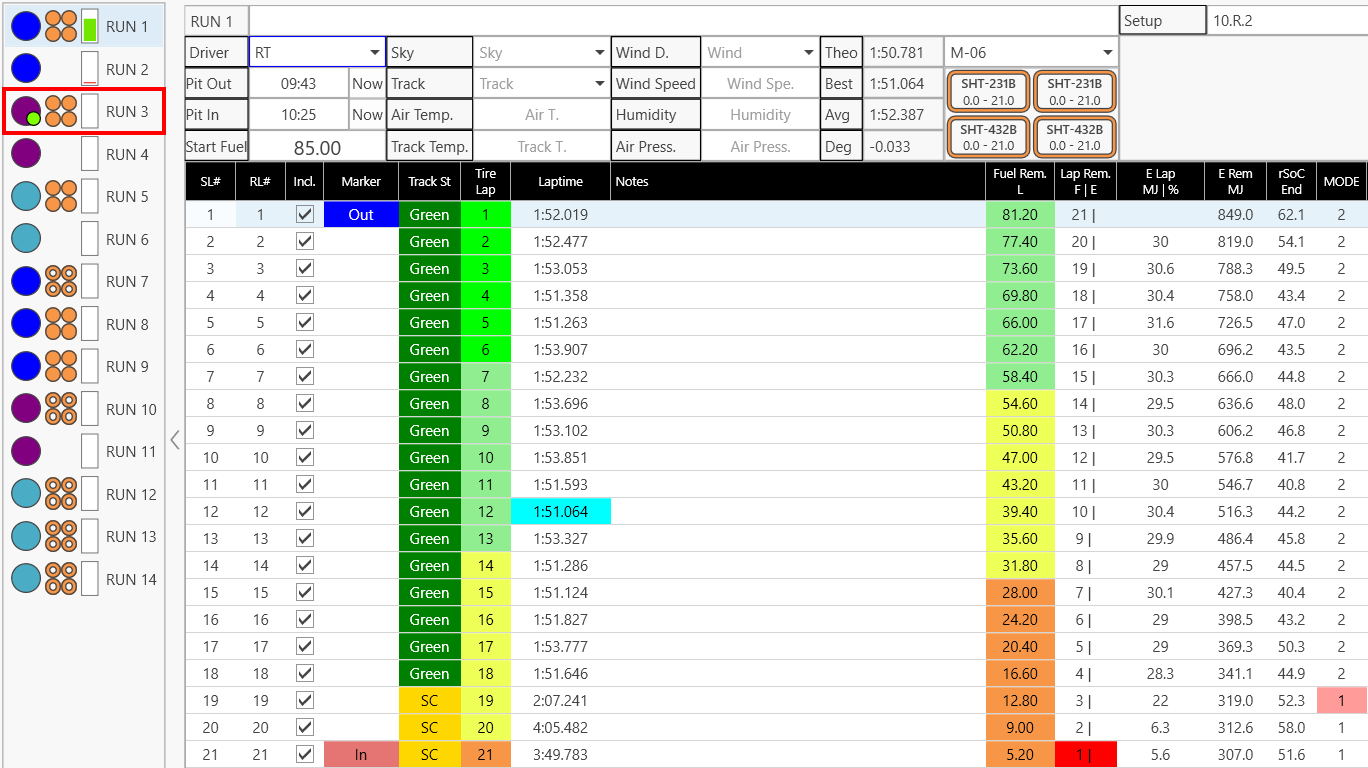
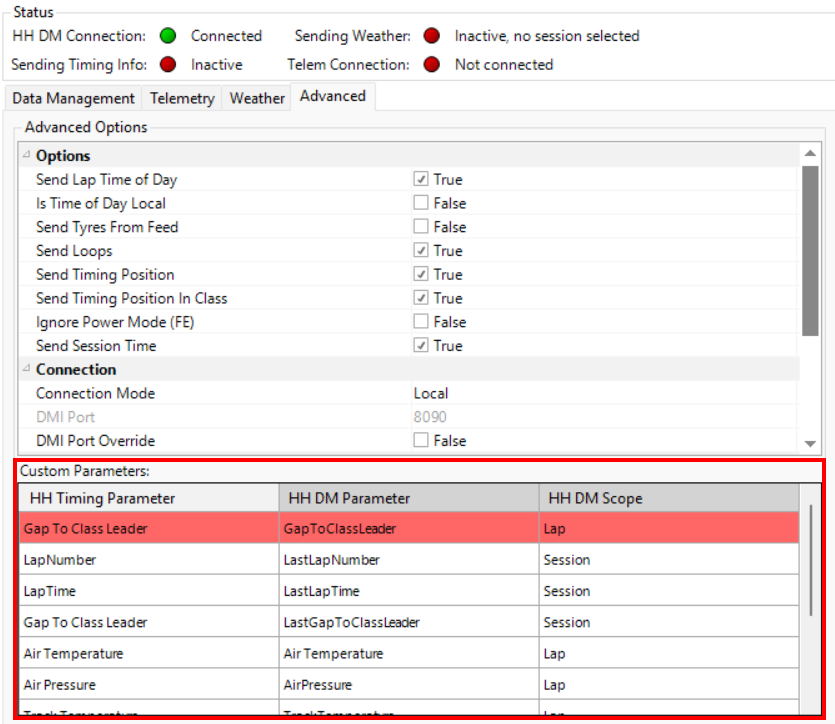
We've integrated live timing feed data with run plans in HH Data Management. HH Timing and DMI now send real-time lap data to the run plan, providing dynamic updates. Setting up HH Data Management is explained in the Live Run Plan section of the help file.

Data viewer

Following the initial release of our Data Viewer earlier this year, we've been diligently working to incorporate additional features based on customer feedback and address existing limitations and bugs.

The list of new features include but are not limited to:

  • Ability to add multiple plots
  • Ability to add scatter plots
  • Offset capabilitites
  • Zoom window functionality (CTRL + Drag for time/Distance plots and left click window on scatter plots)
  • Saving Tab name

Main graph

The Main Graph has undergone continuous enhancements, with the addition of several new features and options to complement its existing functionality.

  • Added cross, plus, and star marker types to enhance data visualization, especially when working with large datasets
  • Ability to send global filter settings between multiple main graphs

  • Ability to define multiple Data set for a graph

KPI

Following feedback from users that the lap count from the logged data doesn't always match laps from the run sheet in HH Data Management, we have added an option to offset the two. This is done in the Runsheet KPI management view using the lap offset column.

Mileage

Initially, our mileage module relied solely on laps from the run sheet to calculate mileage. While this approach effectively serves most customers using HH Data Management, it presents limitations for those tracking large fleets of cars without a complete run sheet. To address this, we've introduced a manual mileage calculation mode.

Assembly

We introduced a new flat model math function called GetMeasurement() that allows to get the value of an assembly iteration measurement parameter.

A practical application of this function is to use assembly iteration measurements in a setup sheet calculation. For instance, if a spring assembly's stiffness is measured annually, we can now retrieve the precise stiffness value corresponding to a specific measurement time and event time.

Math functions

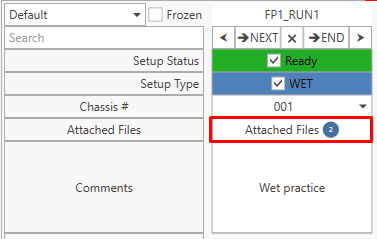
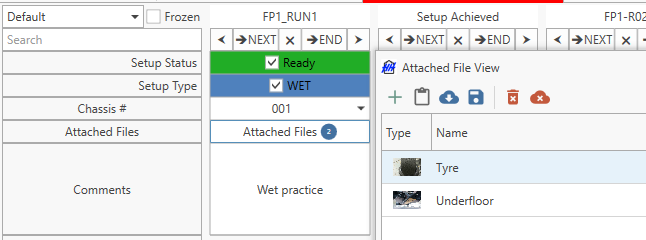
Additional attached file functions

The following functions have been added that allow math expressions to interact with attached files:

Additional numerical Functions

Calculation

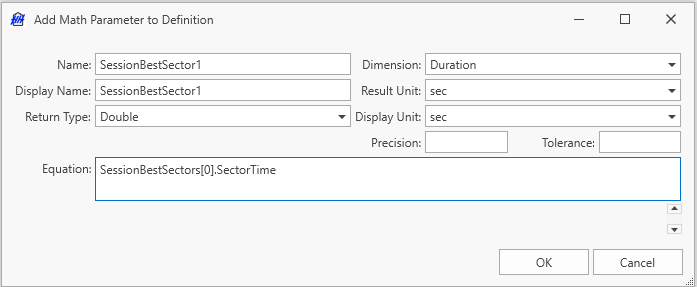
The user can now access the best sectors and best speed traps for each run in the Runsheet scope by their index. This includes both the run-best and session-best values, making it easier to display this information and perform calculations based on it.

Admin Section

Custom grid display (CGD)

One of the major feature from this version is the introduction to the custom grid display (CGD). The CGD is a type of display that allows users to design their own view. The CGD is used to design the run sheet view, so the run sheet can now be customized from within the software without needing to use a plugin.

Custom view

Some improvements have been made to the custom views.

A valuable new feature allows you to filter any custom view using filter expressions. Here some examples of filtering that can be done with this feature:

  • WET/DRY setup only
  • SETDOWN setup only
  • Filter TRACK only sessions

Custom columns

Some improvements have been made to the custom columns.

Actions

Action parameters are used to perform certain functions either when a button is clicked or when triggered by an Action trigger. One example could be to set a ride height increase by increment with a button. Previoulsy this type of logic would have required a plugin to be implemented.

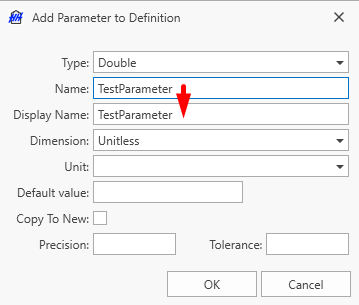
To do so we've added some new parameters into the definition:

Expression binding

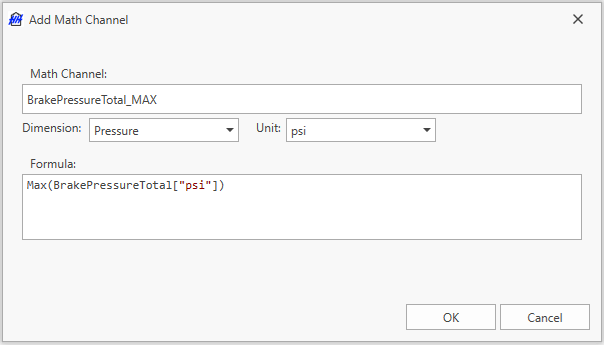
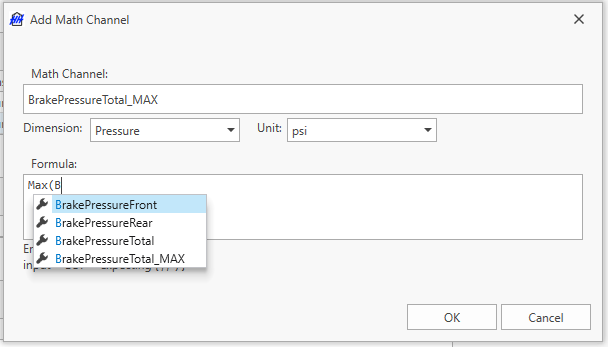
To address the common challenge of entering correct binding paths in the admin sections such as CID or custom columns, we've implemented an option to allow users to write binding paths using math expressions, rather than the currently used WPF binding paths. When writing a binding path using a math expression intellisense is available which makes it easier to write these binding paths.

API

There are some updates to the API as part of this update as well. We have added two new endpoints:

  • Setups/JsonExport
  • Setups/EvaluateExpressions

They are only available for Setups at the moment but will be made available on the other entities in the future.

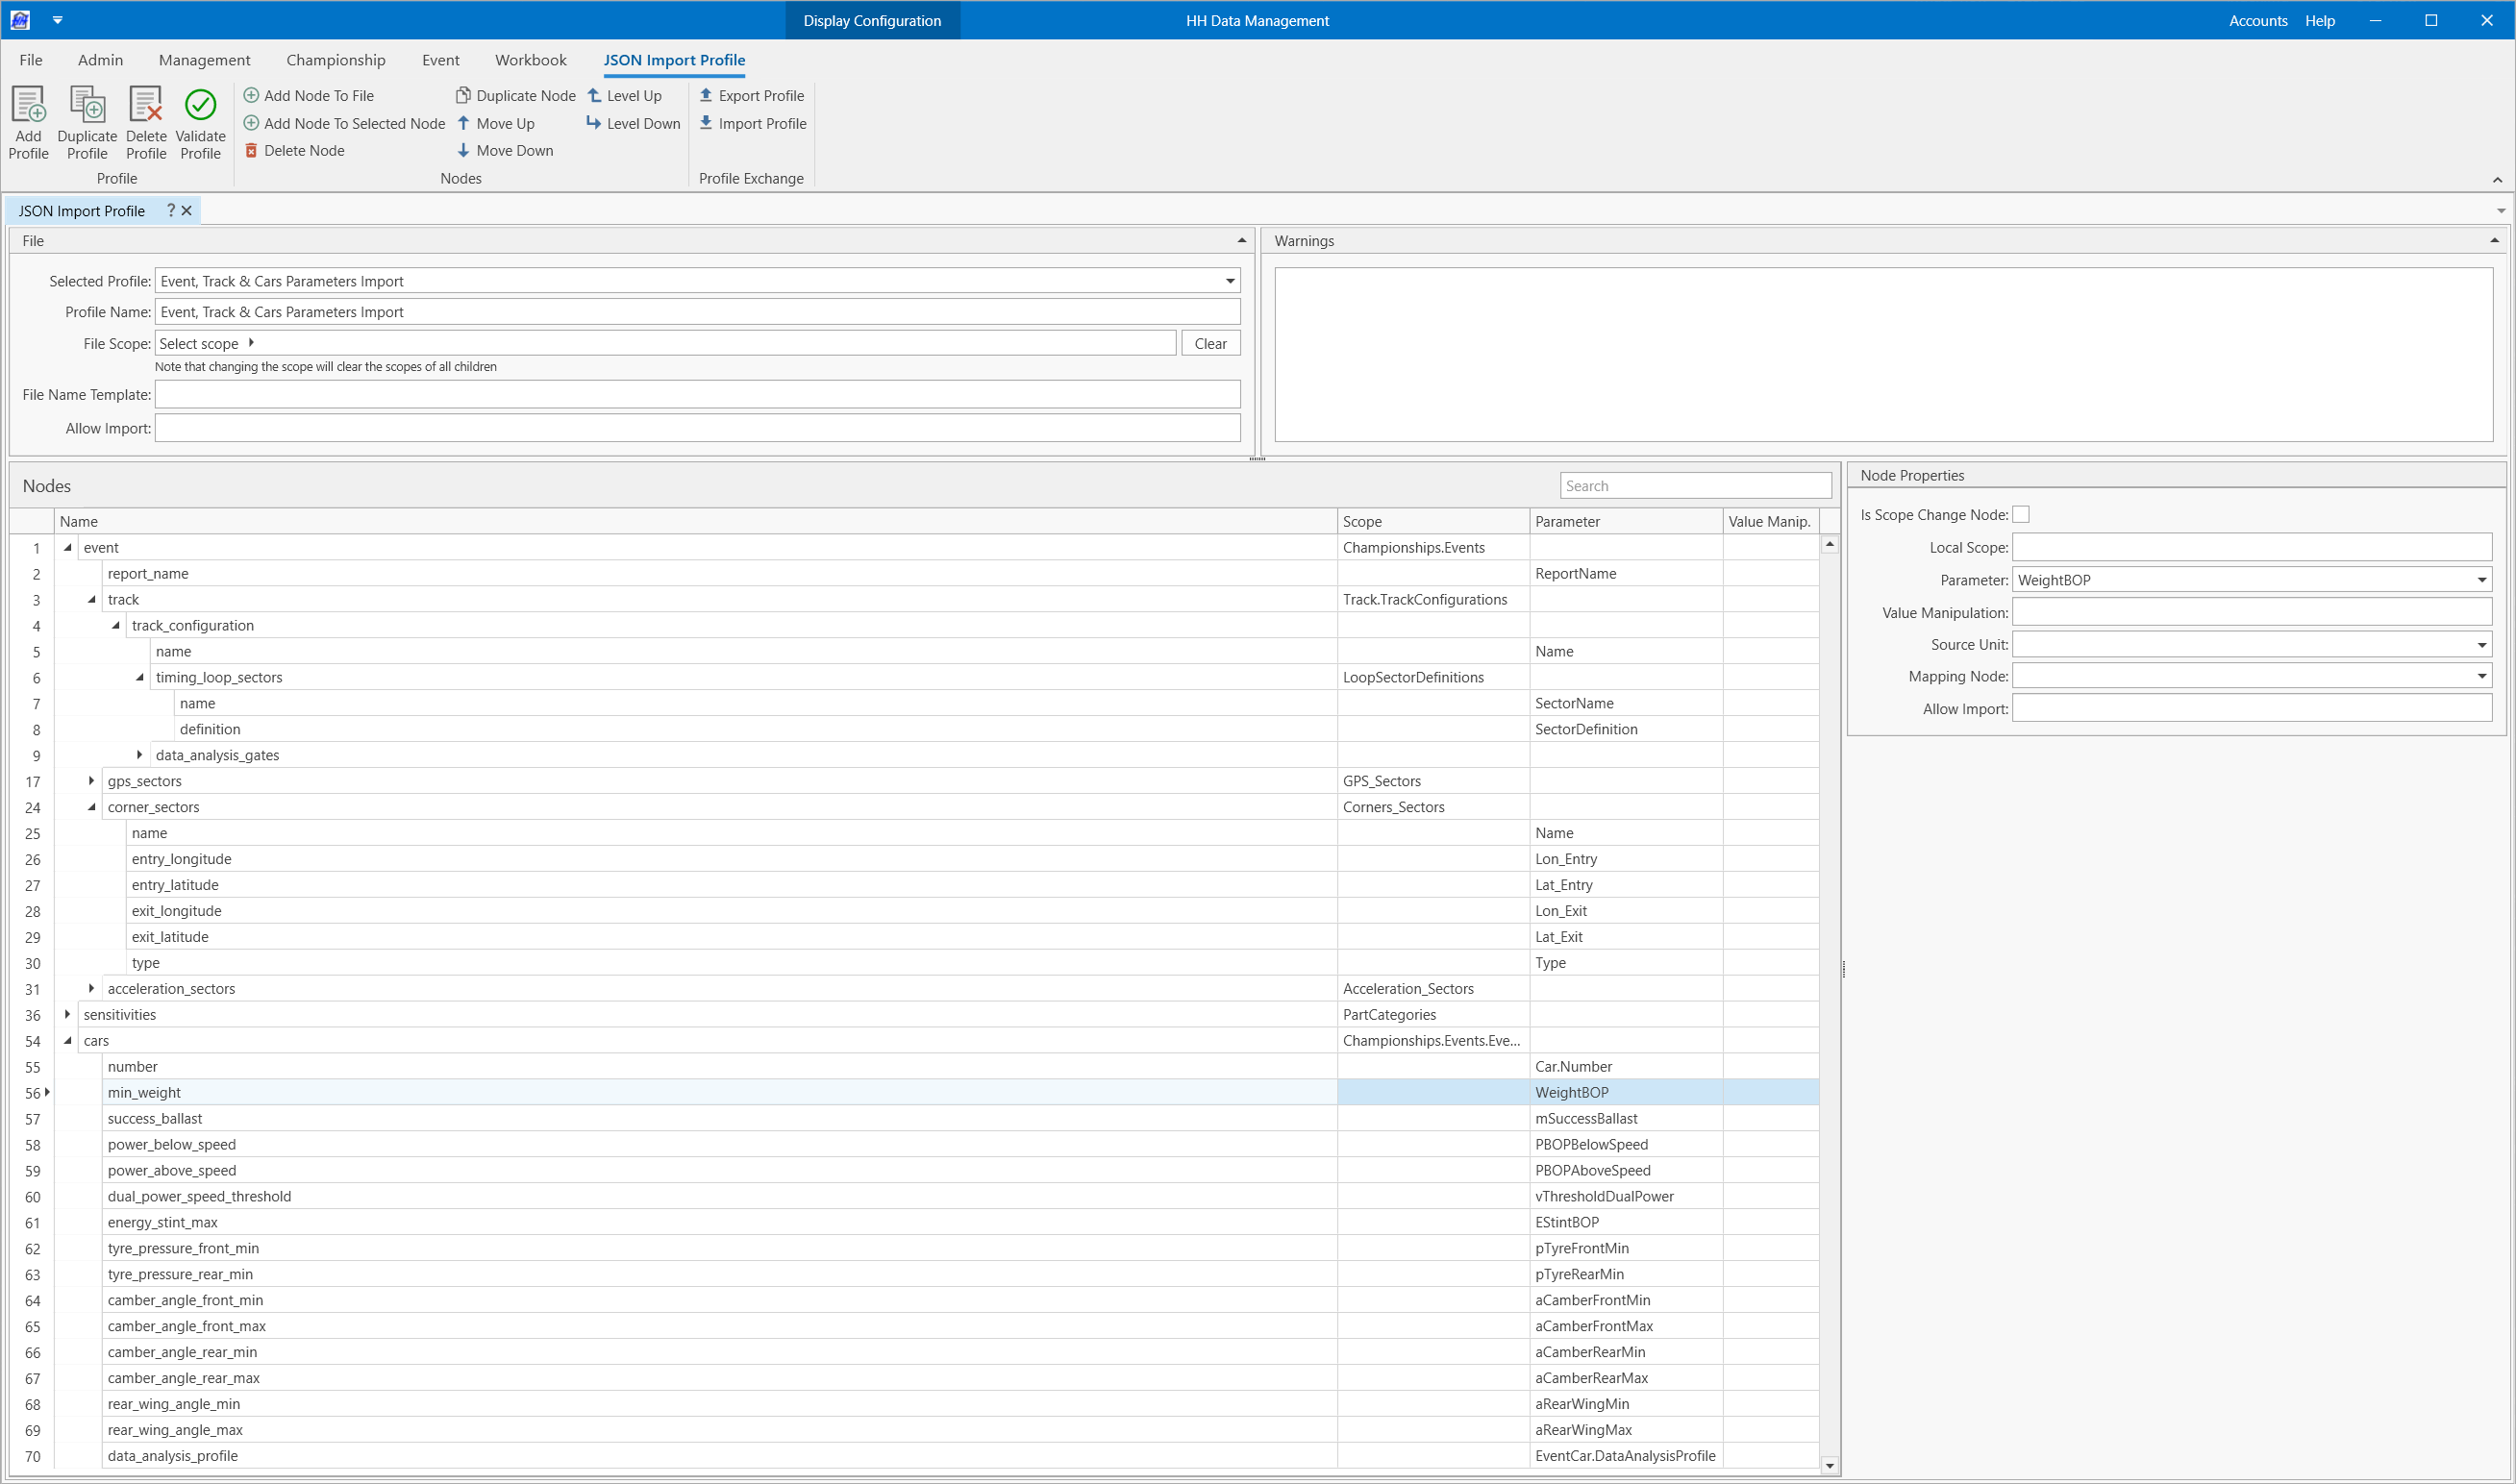
The JsonExport endpoint allows you to pass in a setup ID and Json export profile ID, and it will return the generated Json export. The EvaluateExpressions endpoint allows you to pass in a setup ID and a list of math expressions. These math expressions will then be evaluated against the provided setup. Both of these new endpoints are included in the API documentation.

We have also added support for the attached files math functions on the API. When combined with the new endpoints that have been added this is useful for customers who are storing data in Json files as attached files in HH Data Management. It is now possible to access parameters in the Json files by writing a math expression rather than downloading the attached file and parsing it manually.

Website

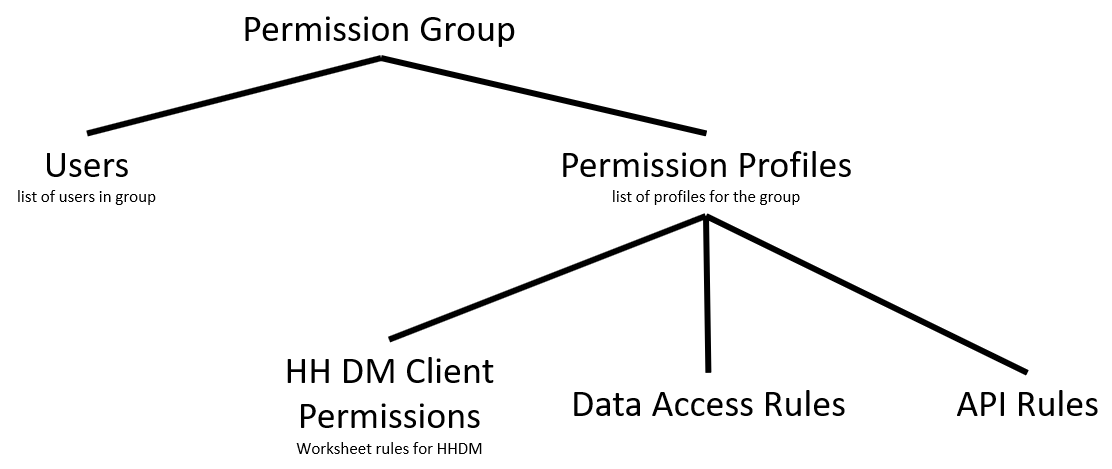
We've redesigned the permissions section of the website for improved user experience. The new layout features tabs for different sections and profiles, making it a lot easier to manage permissions.

Canopy integration

We have started to work on an integration with Canopy. This allows you to trigger, process, and analyze Canopy simulations from within HH Data Management. This is done using the Canopy API. This feature is currently in Beta so please contact us if you are interested to try it.

· 12 min read

Version 24 is a major overhaul of the software. We made technological and structural changes that will allow us to continue improving the software following customers' feedback. We mainly focused on user interface and user interaction while continuing to improve every area of the software.

Installation

Version 24 is a major update with changes to the database schema.

Required

Versions prior to 24 will not be allowed to sync. Any work performed on those versions following the release of version 24 will be lost.

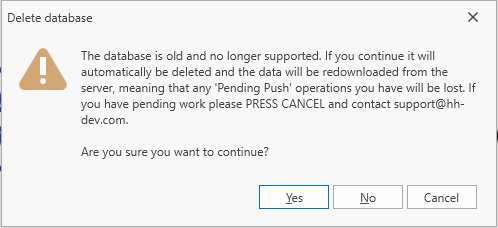
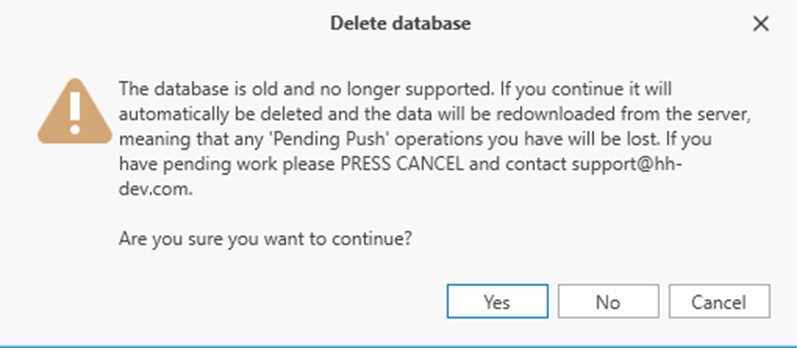
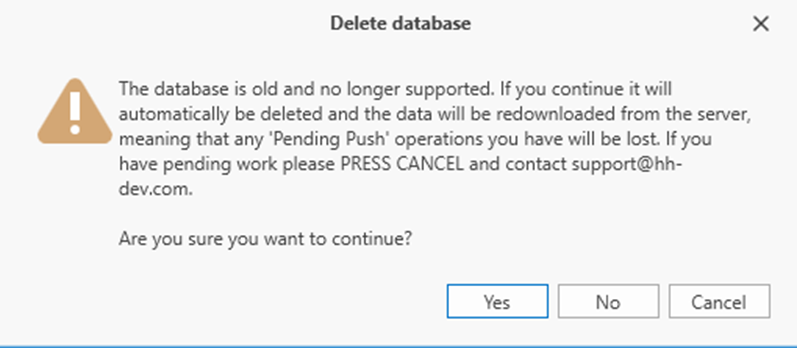
The software should auto-update like previously. When first starting the software on the new version, it will ask to delete the old database:

Please select Yes to continue. HH Data Management will then perform the initial sync of the database.

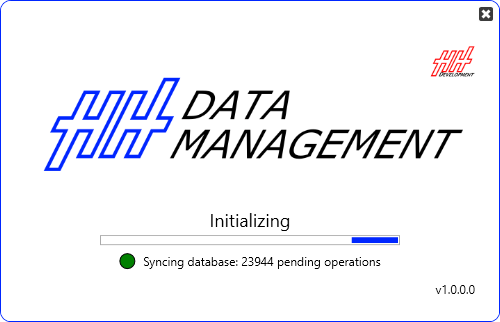
The user is now informed that the software is performing an initial sync:

Following the initial sync previous saved layout will load again and the user can start resubscribing to events and cars.

User management

User display name

Prior to this version, user "display name" was fixed to the initial name entered on user creation. This led to issues with customers not able to fix spelling mistakes or change the user "display name" convention. Starting with this version, the "display name" set on the website will be synced with the server and each client in HH Data Management.

Former user

Previously when using user list selection (like in the job list or issue list for example), every user past and present were listed. We have now added a parameter DeleteDate to the user definition of all accounts. When a user is removed from an account this value will be set to the current time. There is then a new column type called User selector that will filter users based on the start date of the current event and the deleted date of the users.

Info

All migrated users that had already been removed from the account will have their DeletedDate set as the date of the release of version 24.

Granular permissions for admin and management views

Prior to version 24 the permissions for any admin or management view were set by a group access check box. We received a lot of feedback that this was not ideal as some users should be given access to the part database without having access to the entire definition for example. To remedy this, we have extended our regular event worksheet rules permissions to all admin, management, and championship views.

The permission help section has been updated accordingly.

Migration

To make sure that all users were given a similar set of permissions, we have automatically added some client UI rules. If any customers have any questions on permissions, please contact us.

Multiple username/database

Some of our users have multiple usernames to connect to HH Data Management. In most cases it is when they work with different customers. There is now a way to run multiple databases without manually deleting the database everyone. This is explained in the multiple database help section.

User interface

Auto-save layout option

We have added an option in the backstage to auto-save the current layout every 5 min.

Layout recovery

In the case that the software doesn't shut down properly, the user will be prompted with a choice of loading an empty layout, a temporary saved layout, or the previous layout.

Toast notifications

In a bid to improve notification information throughout the software, toast notifications are now available in HH Data Management.

Starting in version 24, toast notifications are used for all profile export, but the goal is to expand it at the start of year (Job list notification, setup change, etc..).

Plugin

Toast notifications can also be used from plugins already.

Run sheet

In version 24 the user interface of the default run sheet was improved. We took into consideration feedback received over the past year to improve the usability and look of the run sheet.

Here are some of the changes:

  • Slider to control different areas of the run sheet.
  • Engineering list added.
  • Ability to add a RunSheet CID in a tab to allow for calculation without any integration.
  • Track map display.
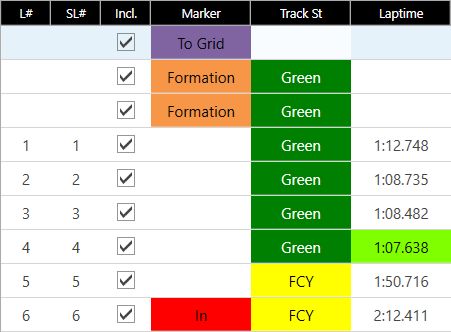
  • Fuel calculation was redesigned to allow for telemetry input (decreasing or increasing).
  • New cleaner top bar.
  • Option to have setup sheet inside a TAB or outside.
Custom run sheet

For most customers with a custom run sheet, we have not adapted the customized run sheet to use some of the new features of the default one. Feel free to contact us if you want to review the different options available.

Run plan

Customise calculation

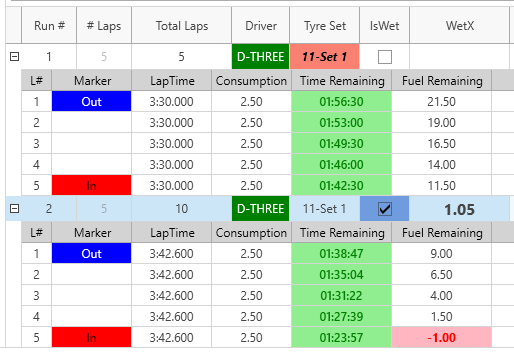
We received a lot of feedback that the run plan in HH Data Management was lacking options to customise lap time and fuel consumption based on different parameters. One of the most obvious was the ability to do WET run plan for example or to differentiate lap time and fuel consumption between different drivers.

Two maths parameters called LapTimeMultiplier and FuelConsMultiplier can now be used to control lap time and fuel consumption at either the run or the lap level.

Example

Here is an example with a IsWet checkbox and a ratio directly on the run plan to control the lap time.

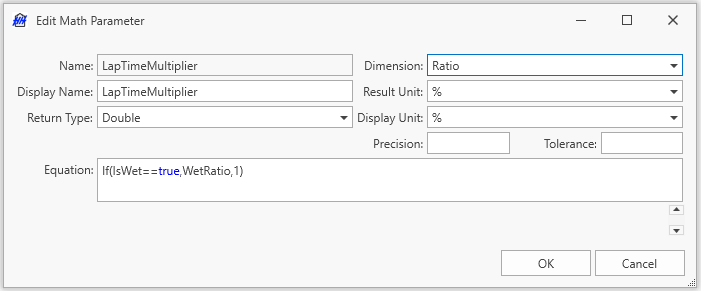
Here is the simple formula used:

Main graph

Graph type templates

In version 24 we have added the ability to save graph type templates into the database. This will allow users to re-use their favorite graphs without having to rebuild them from scratch every time.

Libraries

Prior to version 24, both the series appearance library and the panel scope library were only saved locally in a layout. Starting in version 24, both libraries will be saved in the database. This will allow for better collaboration between team members and harmonized analysis.

The syncing of both libraries to the database will happen automatically like within the rest of the software.

Old layout

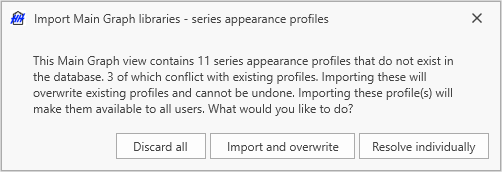
When working with an old layout, the first time that a user will edit a main graph, HH Data Management will prompt a message box to ask if the user wants to import the modified series appearance or panel scope. Both libraries were stored previously in the layout and now they need to be stored in the database.

Here is an example of the message box:

The three options are:

  • Discard all - It will ignore importing the saved series appearance and/or panel scope from the layout.
  • Import and overwrite - It will import and overwrite all saved series appearance and/or panel scope from the layout.
  • Resolve individually - It will allow to import saved series appearance and/or panel scope from the layout one by one.

If you have any doubt on how to deal with the new syncing of the libraries, feel free to send us your layouts and we can handle the migration for you.

Data selection user interface

The data selection user interface was re-worked. The user can now collapse and expand the tree as well as drag the position of each tab, panel, and graph individually.

Series settings

A new field in the series settings called series ordering was added to set the order of the series.

The series title was also changed to be able to accept the parameter name as input.

Ordinal x-axis

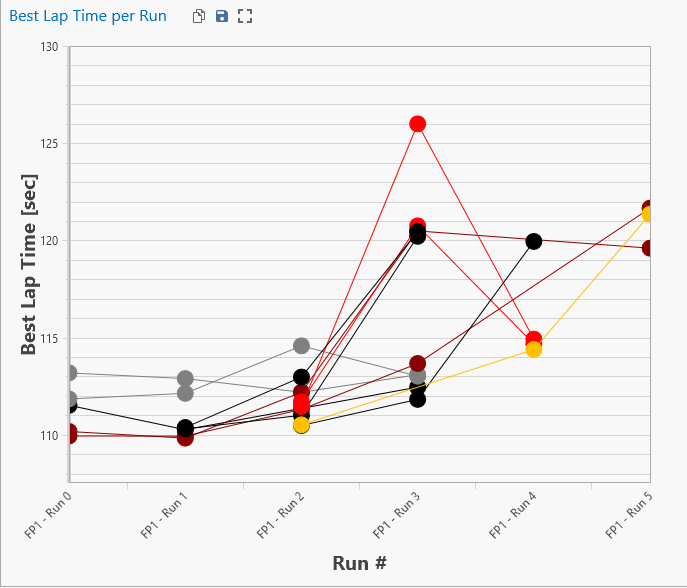
One major limitation on the main graph was the inability to plot anything else than numbers on the X-Axis. For example, setup evolution per events or parameters per run.

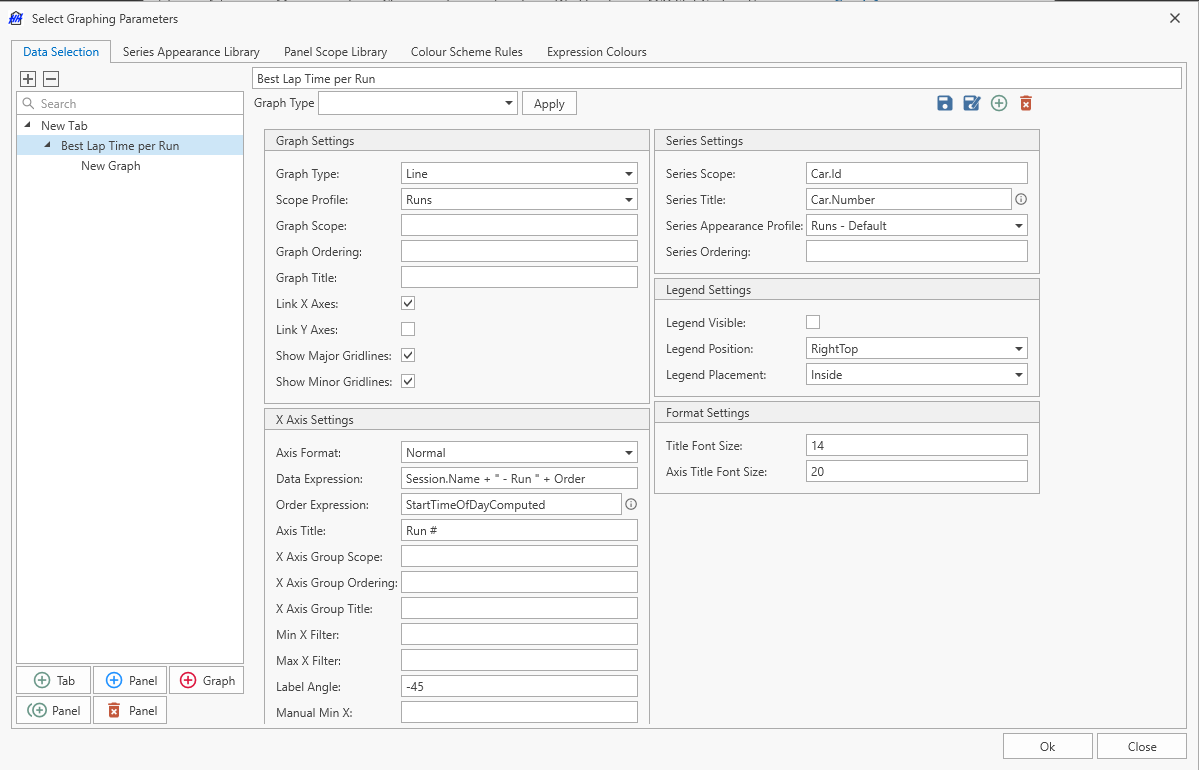
It is now possible to set a string parameter in the Data Expression of the x-axis settings. And the order can be controlled by the Order Expression parameter.

Example

Here is an example to plot the best lap time per run for all cars:

Raising average

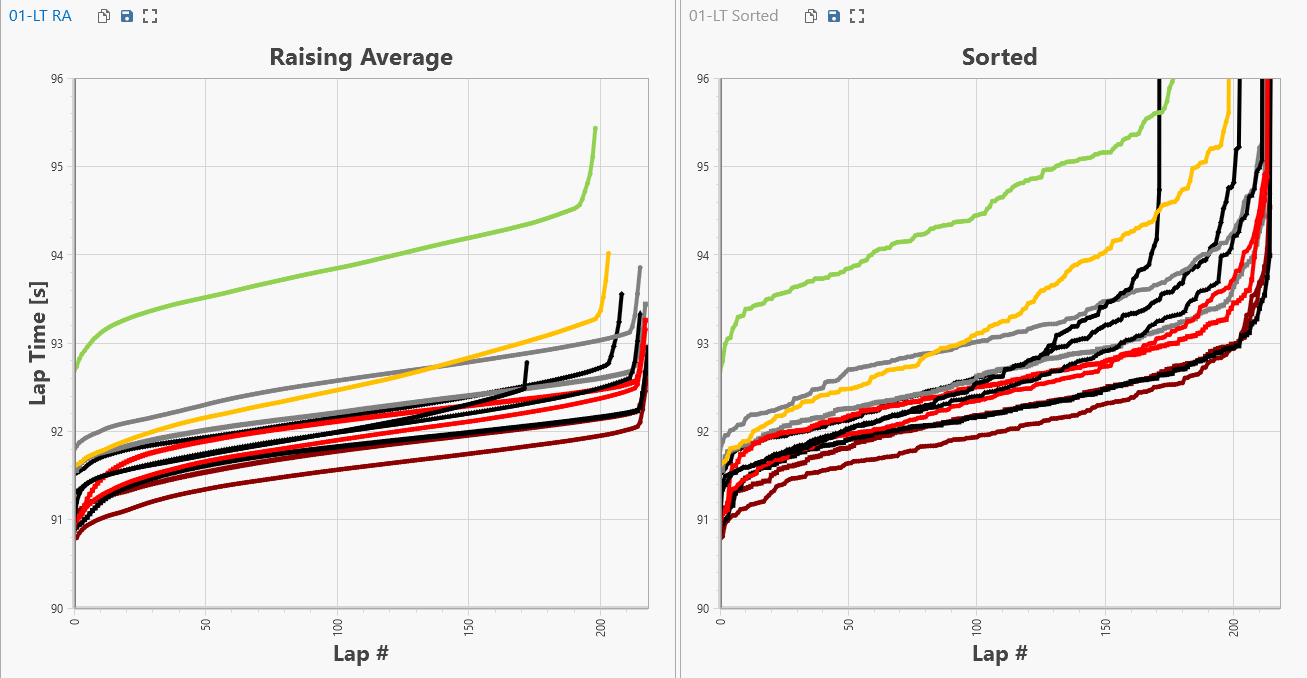
A new option in the settings of the raising average was added. It allows to calculate or not the average. When off, the series will just get ordered either from smallest to largest or largest to smallest depending on the setting.

Here is a comparison with the average calculated (left) and without (right):

Assemblies

Assemblies were very well received in the first year of our mileage module. One feedback we received though was that we were missing one level for organising assembly iterations efficiently. We then decided to rework the assemblies and added one level called Named assembly. The help file for assemblies got updated as well.

Example

Let's take the example of a customer with two damper sets.

Version 23

Assembly Type

  • Damper Set

Assembly Iteration

  • Damper Set 1 - Event 01
  • Damper Set 2 - Event 01
  • Damper Set 1 - Event 02
  • Damper Set 2 - Event 02
  • Damper Set 1 - Event 03
  • Damper Set 2 - Event 03

For each event, a new iteration needed to be created and the list of iterations in the CID was getting quite long in some cases and it was also getting difficult to find the correct iteration.

Version 24

Assembly Type

  • Damper Set

Named Assembly

  • Damper Set 1
  • Damper Set 2

Assembly Iteration Damper Set 1

  • Event 01
  • Event 02
  • Event 03

Assembly Iteration Damper Set 2

  • Event 01
  • Event 02
  • Event 03

In a CID, the user can just select the named assembly and the latest assembly iteration will get selected automatically. Or the assembly iteration can also be selected directly.

Migration

For users that used assemblies in version 23, all assembly iterations for each assembly type were moved to a default named assemblies called DefaultNamedAssembly.

Custom columns

Attached files

It is now possible to add single and multiple attached files columns in the custom columns.

Example

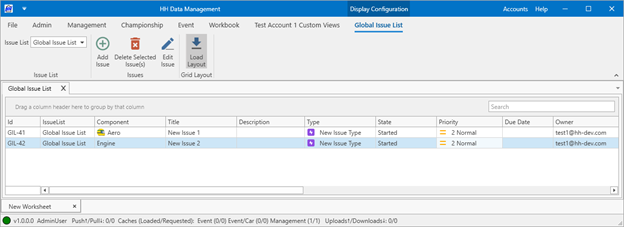
Example from the issue list using a single attached file column to store a picture and the multiple attached file column to store additional files:

Style option

Custom columns style can now be edited in a similar way to the CID cells. The style setting help file can be accessed here.

Corner input box

A new parameter in custom column called column type was added. This allows to define a column as a single parameter, front/rear parameters, left/right parameters, or corner parameter. Those cells had to previously be done from the plugin.

Each parameters style can be edited individually.

Example

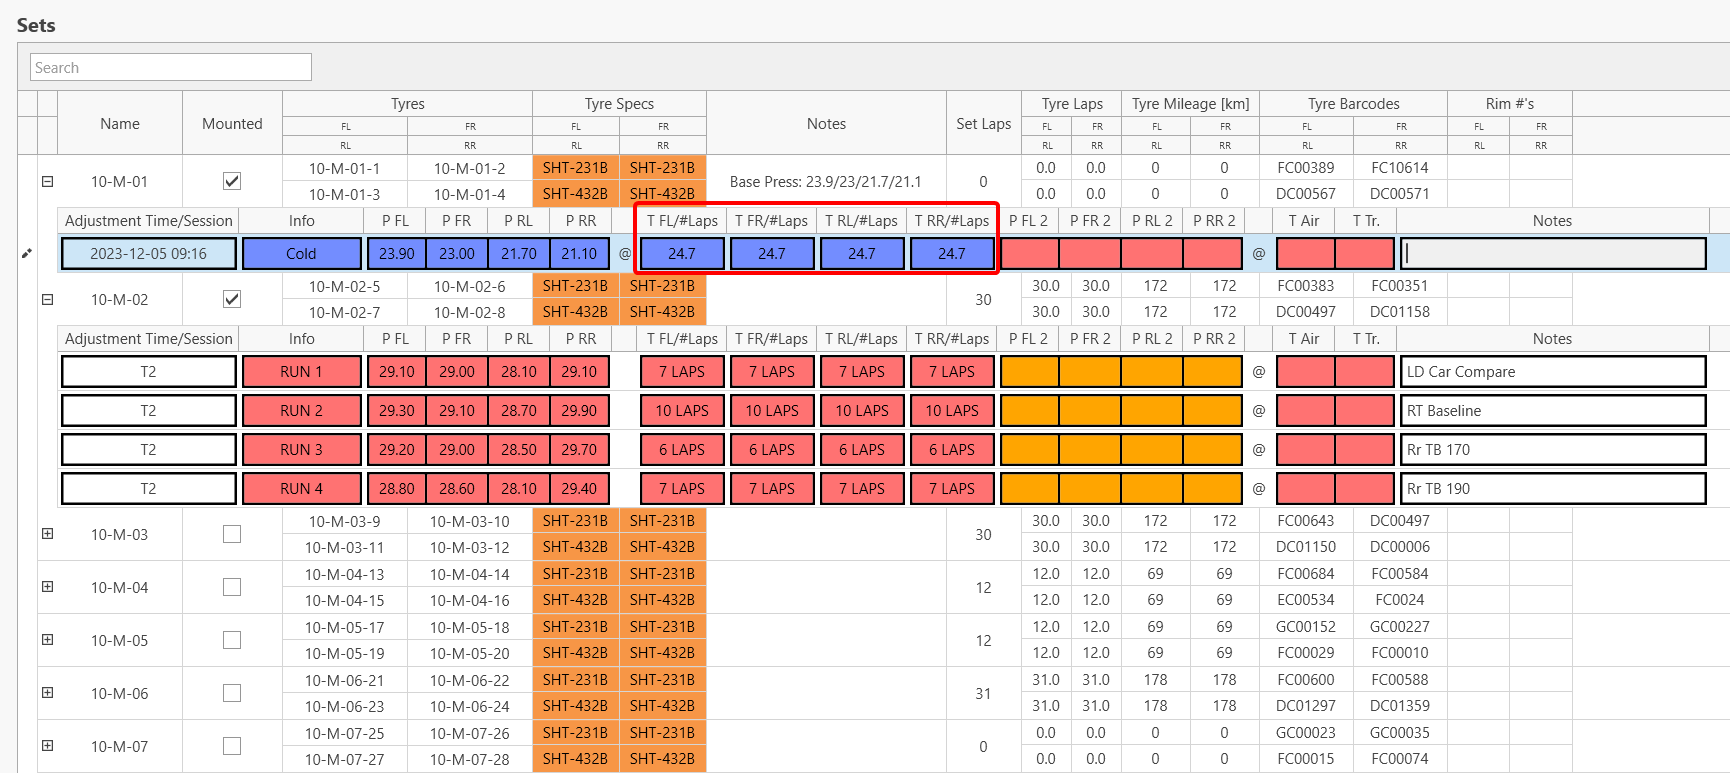
Setting up a tyre batch input cells for the 4 corners:

Conditional math parameter

In version 24 we have added the ability to have a custom column that is a conditional math parameter.

Column Item Definition (CID)

File dialog button

A file dialog button was added to the cell options. The goal was to be able to select files and/or folders and save their path in parameters. Those paths can then be re-used for other purposes such as exporting for example.

Example

Setting up an export folder in a Setup CID

Maths

Collection interpolation

1D and 2D interpolation from collection items were added in version 24.

Event lap counter

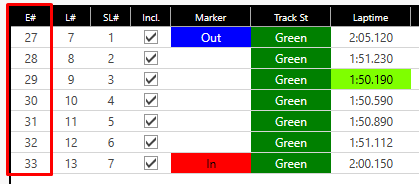
There is now a property on the lap flat model called EventLapNumber that gives an event-based counter for the laps.

This can be used to plot all laps from an event on a main graph or display the total number of laps in the run sheet.

Lap count properties
  • EventLapNumber - Event lap counter
  • TotalLaps - Session lap counter
  • OutingLaps - Outing lap counter

New math functions

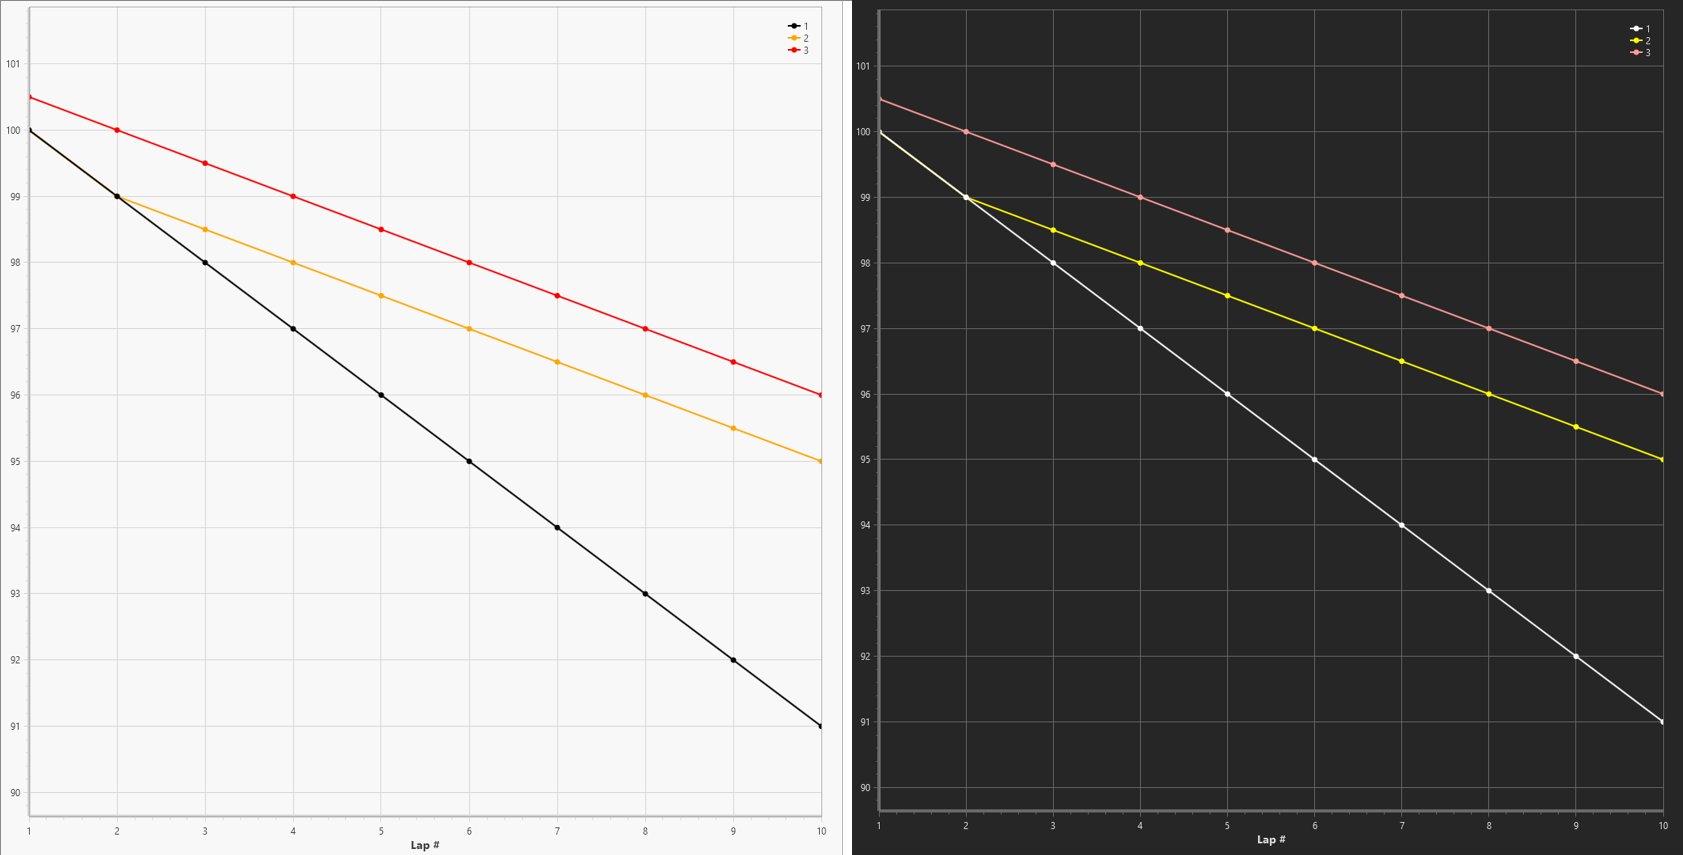
Example theme usage

The user can define different colors for the car for example:

Then using a formula using GetThemeName(), the correct color can be retrieved based on the theme.

Example formula: If(GetThemeName()=="Light",RunSheet.Car.Color,RunSheet.Car.ColorDark)

danger

The theme only refreshes after a software restart currently.

Key Performance Indicators (KPIs)

Data channel aliases order

To allow for better customisation and different file handling, the order of data channel aliases can be now changed.

New KPIs functions

Three new KPIs function were added. They all allowed to deal with collections and plot collection results easier.

Example

With a collection of GPS sector time calculated for every corner on the track, the user can now use the SumAll expression to get the time spent in corners in a lap.

Misc.

Track sectors

When defining sectors on a track configuration, there is a new column called "Is Track sector". This was added to be able to add sectors that shouldn't be taken into account in theoretical lap time calculation.

Example

A good example is in Le Mans where there are the three main sectors but also some additional sectors such as the Porsche curve and the Ford chicane.

Only S1/S2/S3 are used to calculate the theoretical lap time:

API wrappers

Starting with version 24, we have updated our .NET and Python wrapper as well as their documentation.

Additionally, the .Net wrapper is now available on Nuget

· 5 min read

The October 2023 feature release is an update to v23.2 and includes many improvements to HH Data Management. Many of these were requested by you, so thanks for continuously sharing your feedback and ideas! As usual, if you have any questions or issues with the release please contact us using support@hh-dev.com.

Installation

This is a regular update to HH Data Management that is not a mandatory update. The software will auto-update like normal from the software.

User interface

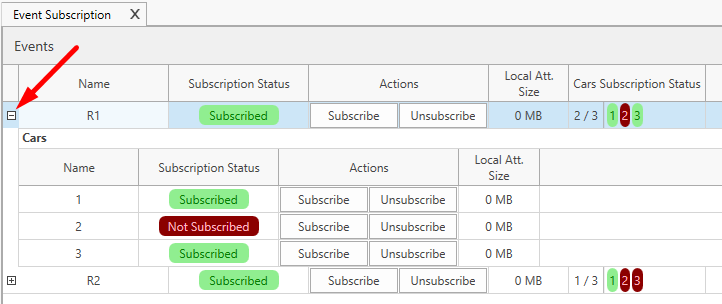
Event subscription user interface

We have revisited the subscription page of the software that was often prone to mistake and confusion.

It should be a lot clearer now to see if a user is subscribed to an event and to a car in a specific event. Under the column "Cars Subscription status", the cars subscribed to are displayed in green.

The car selection is done by expanding the event:

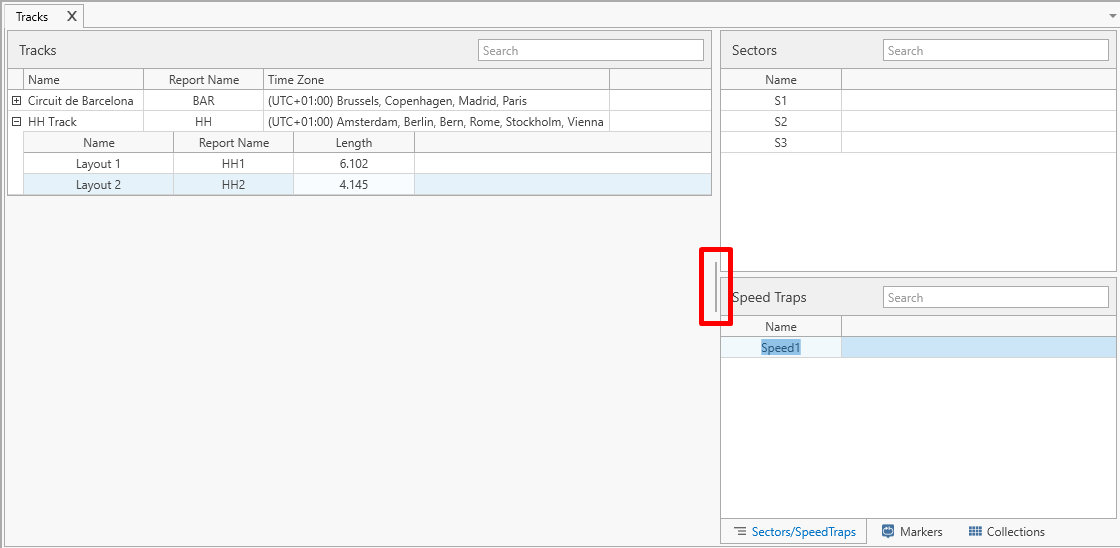
Track user interface

The track user interface was revisited to include a slider on the right side for the sectors, speed traps, lap markers and collections. This will help mainly on accounts with a lot of parameters stored on the track or the track configuration profiles.

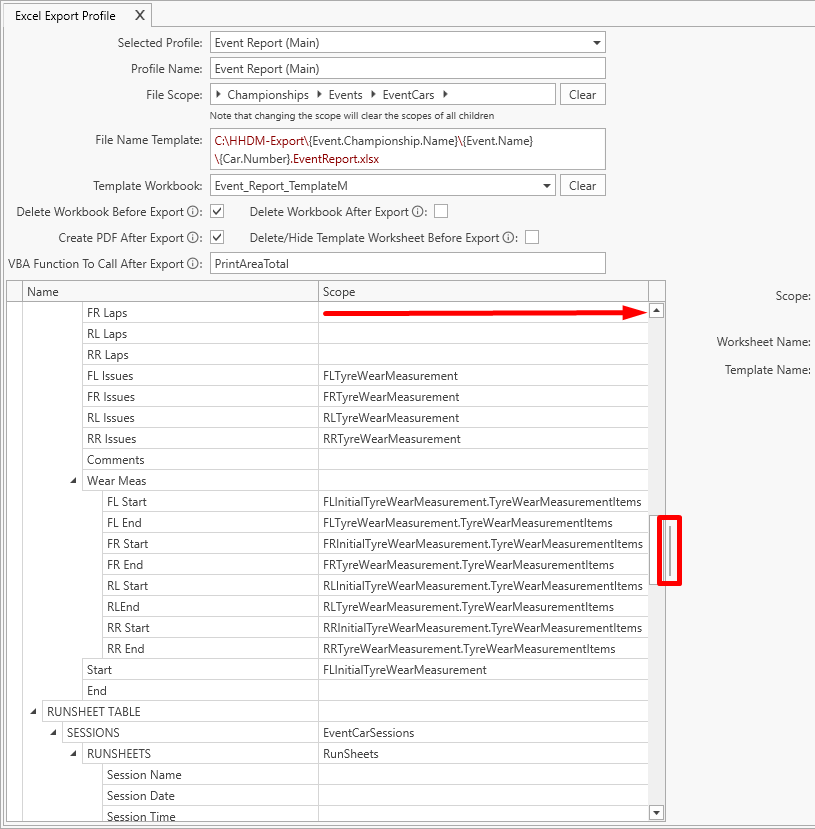
Export profile

The user interface for all profile was quite limited in the past. We have re-worked it so each column can now be extended to facilitate working on those profiles. This was done with the help of a slider:

Main graph

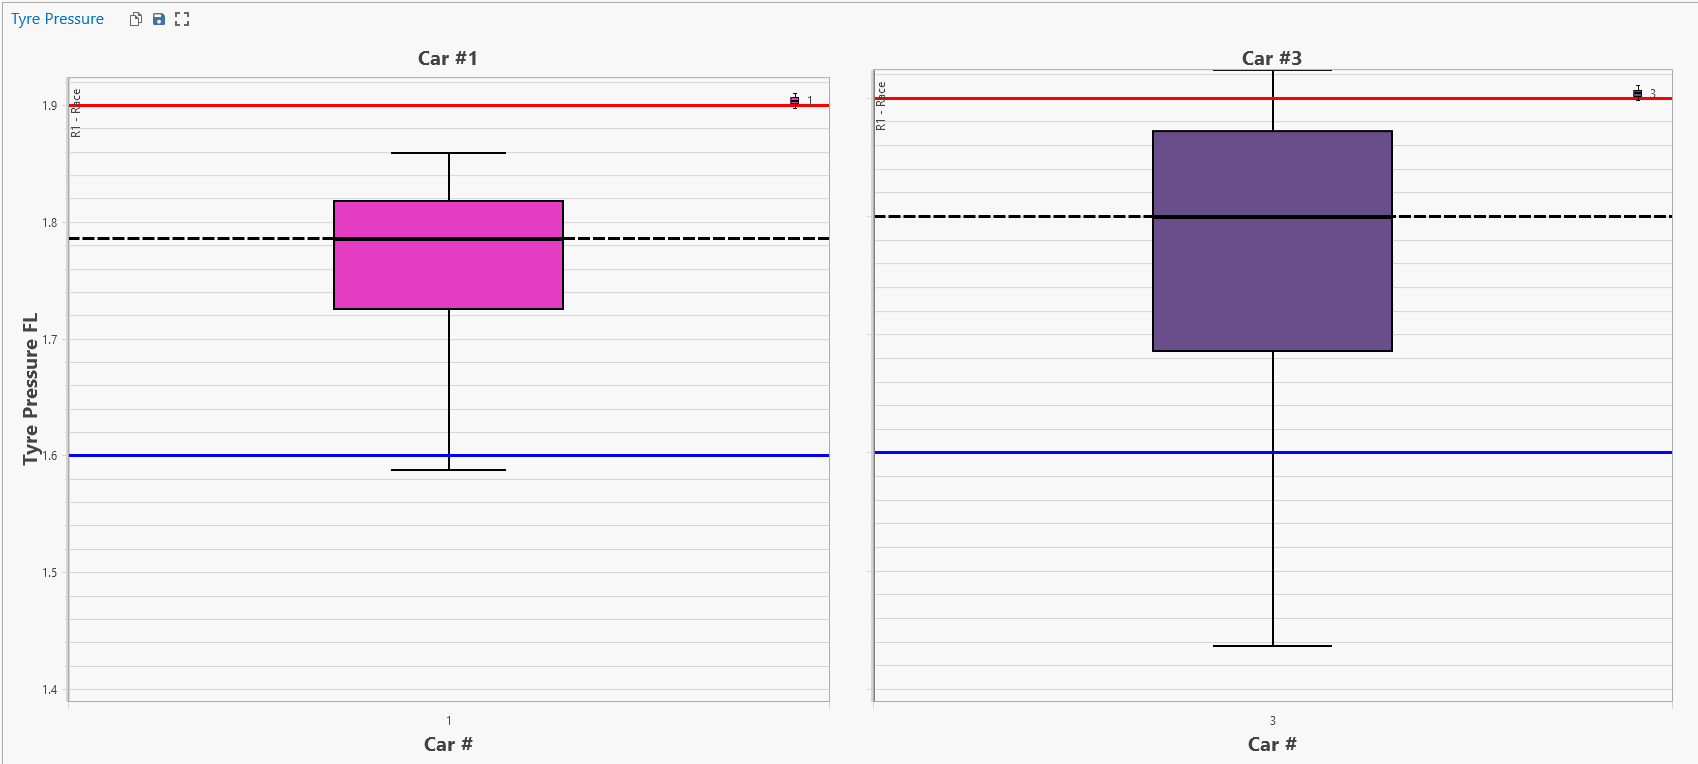
Box plot

We have added a few options to the Box plot in the main graphs:

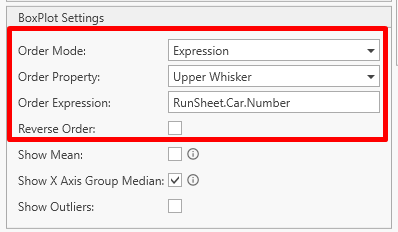
First of all the order of the box plots can be controlled. By default, the order is controlled by the median like it was done previously.

But now the order mode can be of two types:

  • Box plot property
    • Median
    • Upper Whisker
    • Lower Whisker
    • Third Quartil
    • Fist Quartil
  • Expression

The expression option allows to always order by car number for example, or by driver name. So entities always show in the same order.

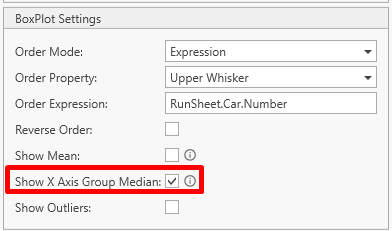
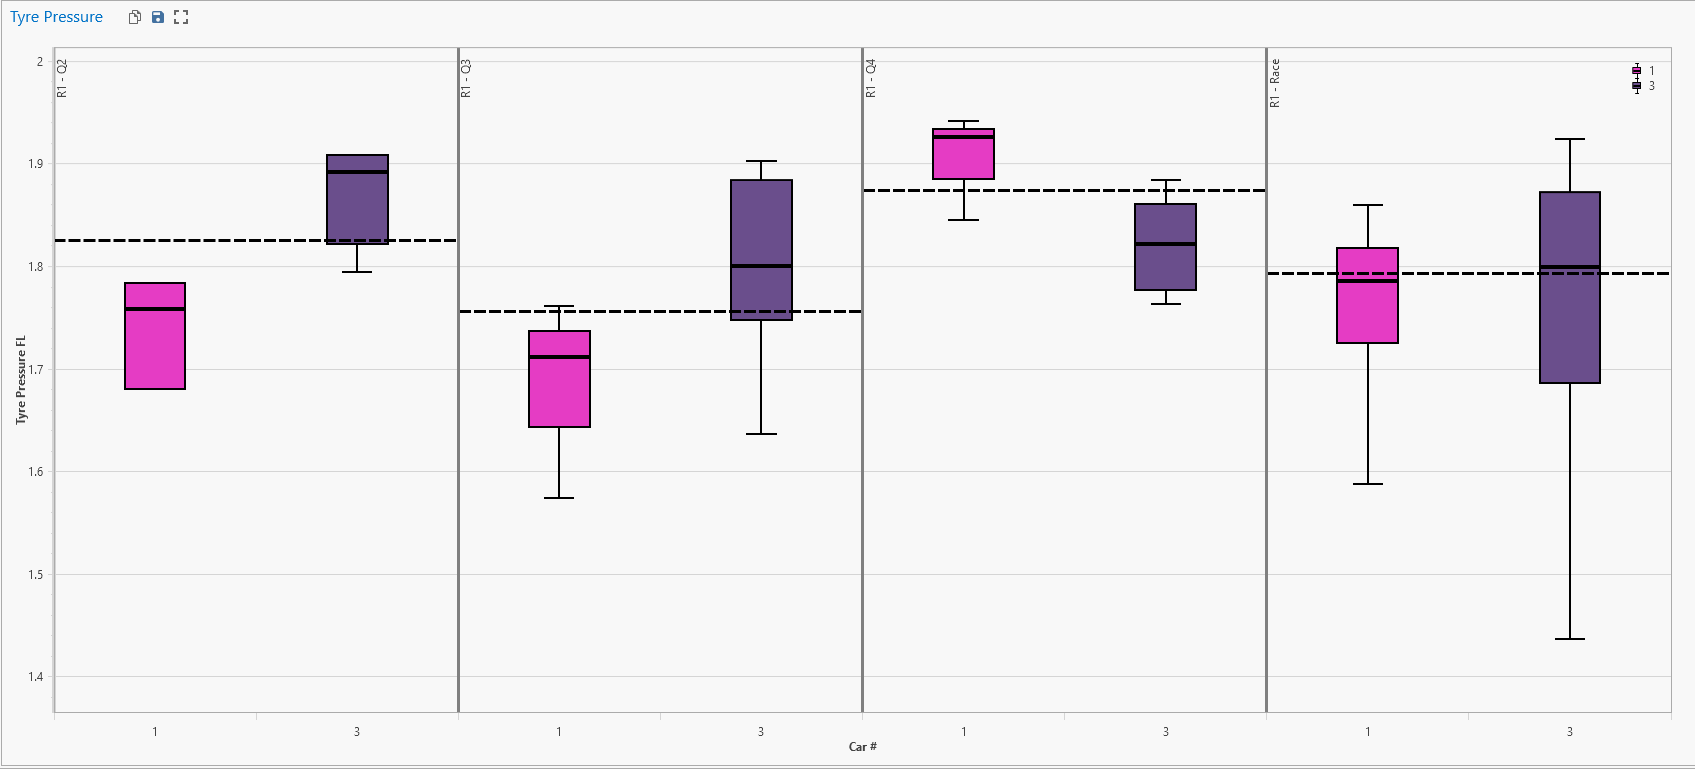
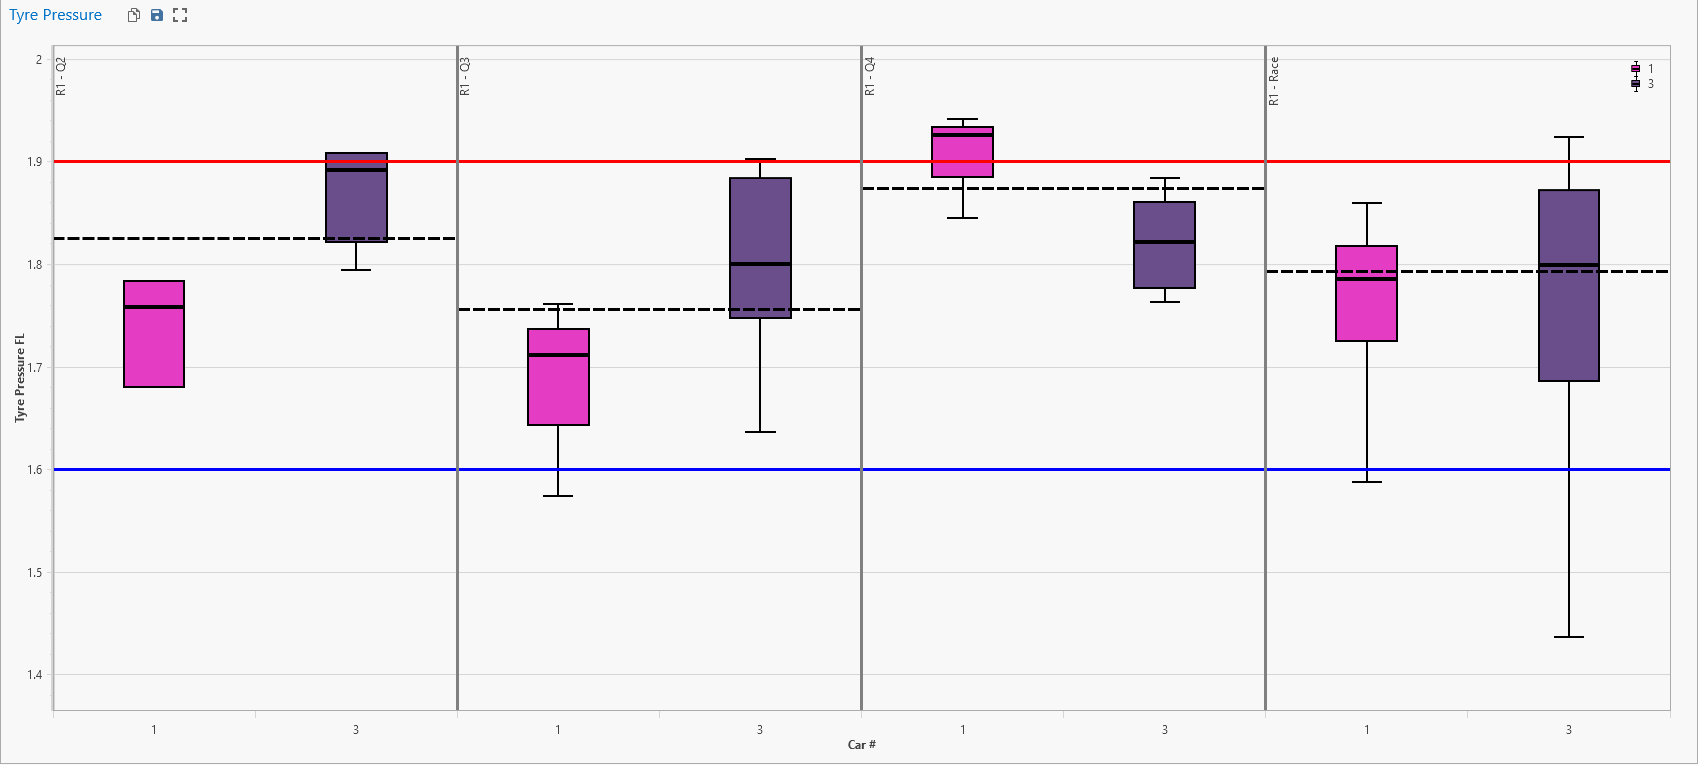
The "Show axis group median" option always to show for each x-axis scope a median of all box plots.

Here is an example of a front left tyre pressure graphs for 2 cars for multiple session:

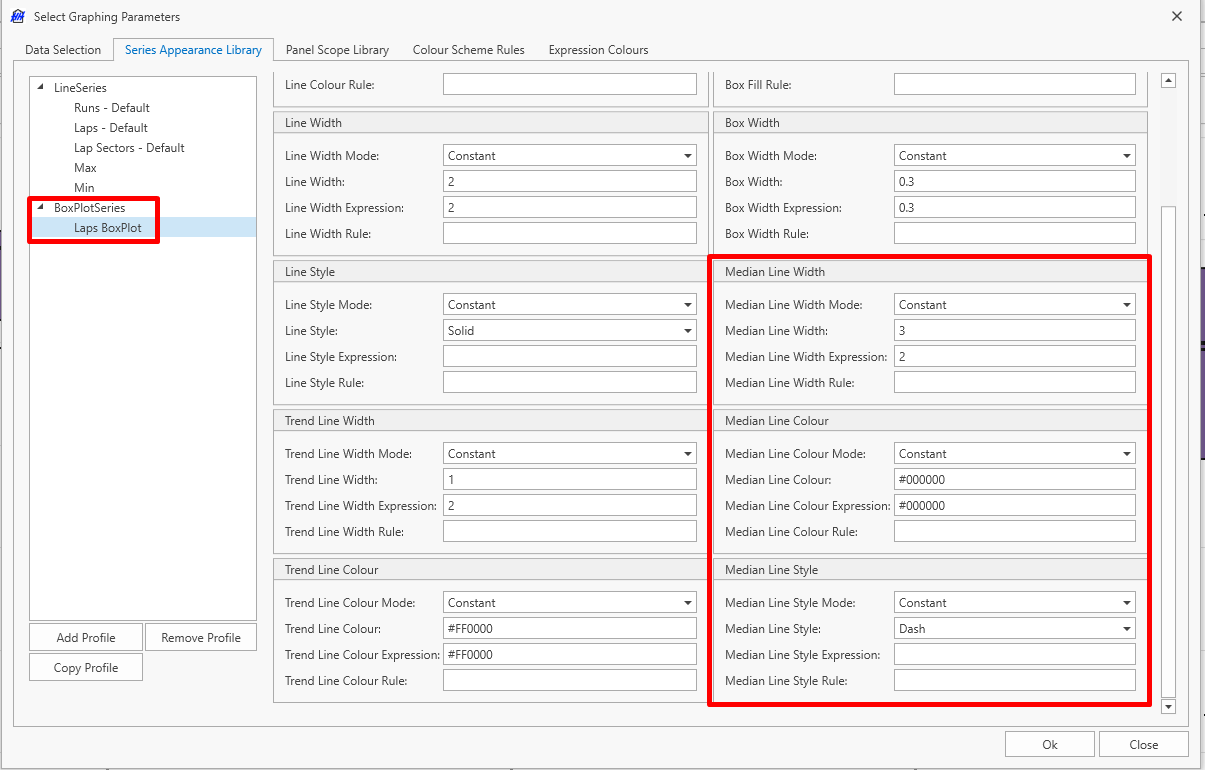
The median style can be controlled from the series appearance:

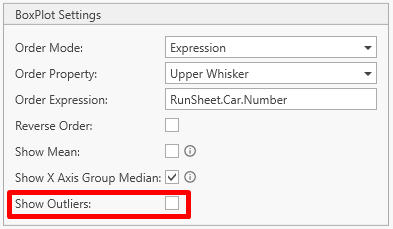
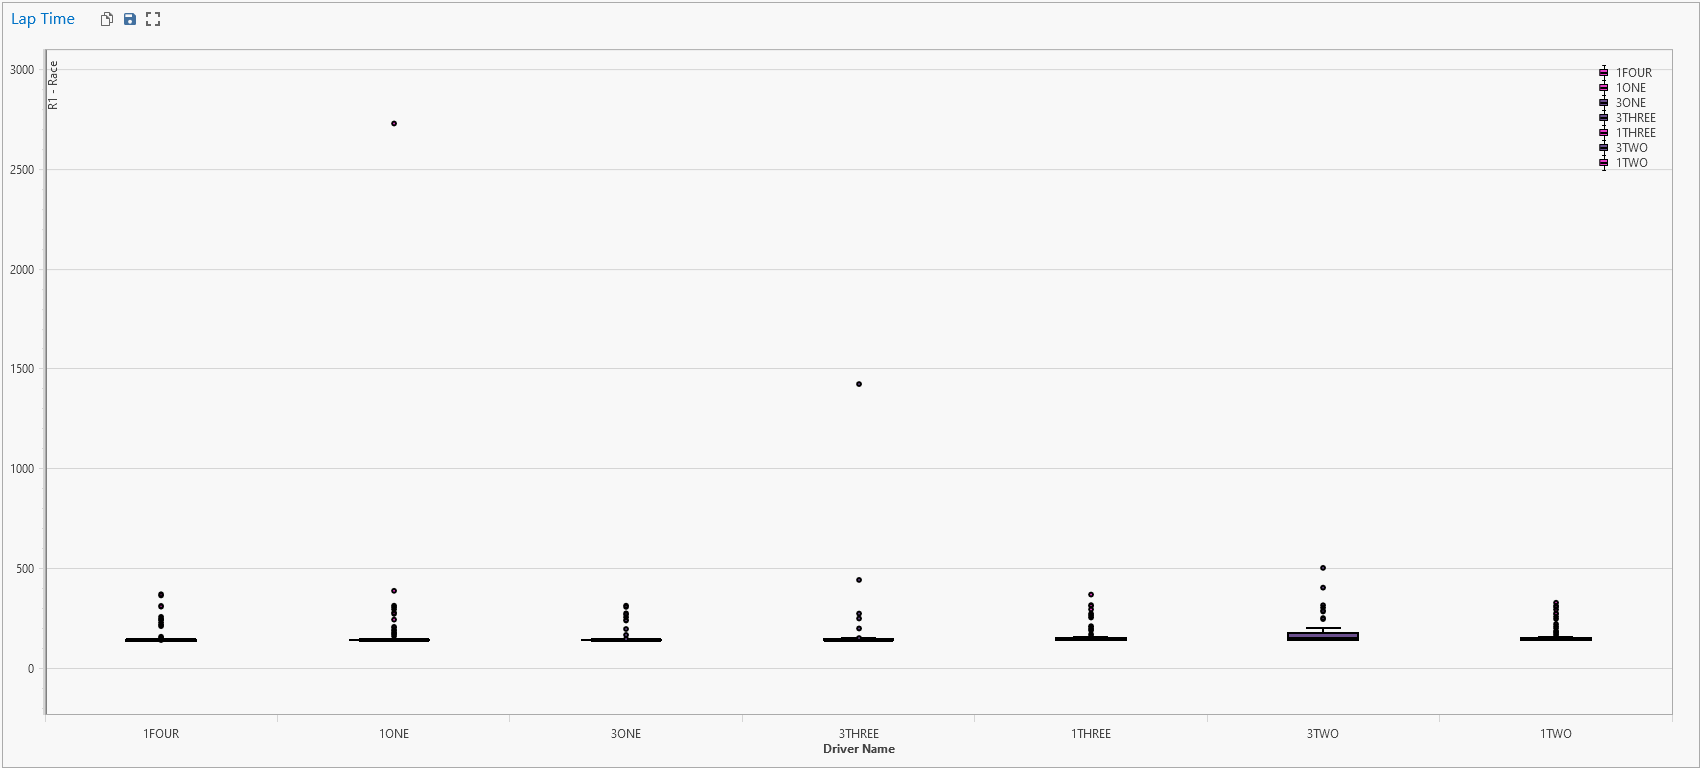
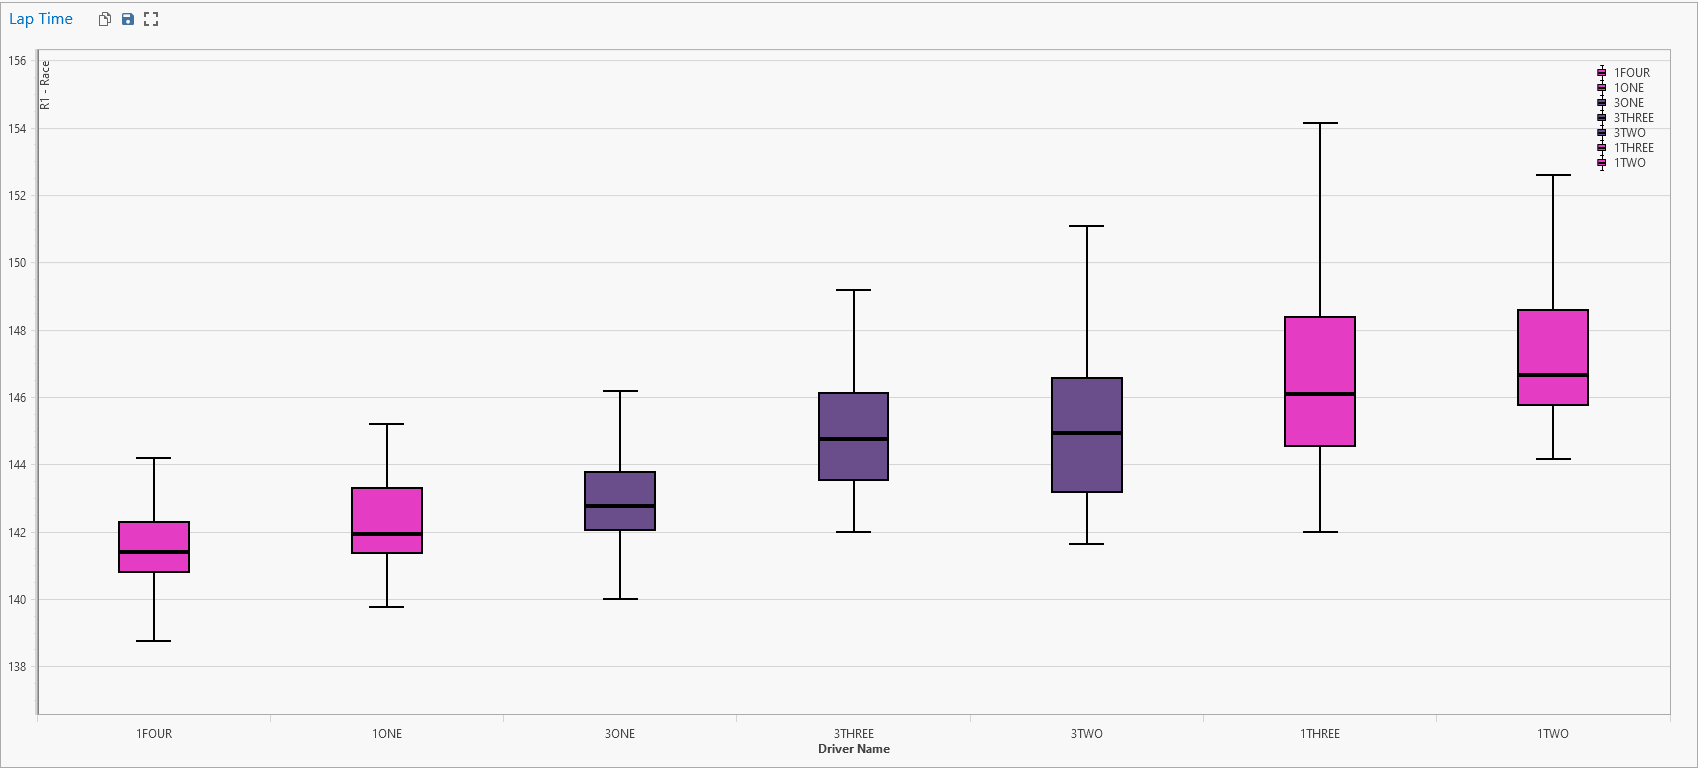
The last option is the ability to remove outliers from the graphs. This can be quite useful to auto-scale the graphs on the box plot only:

Here is an example with outliers of lap times for drivers from multiple cars:

Without outliers:

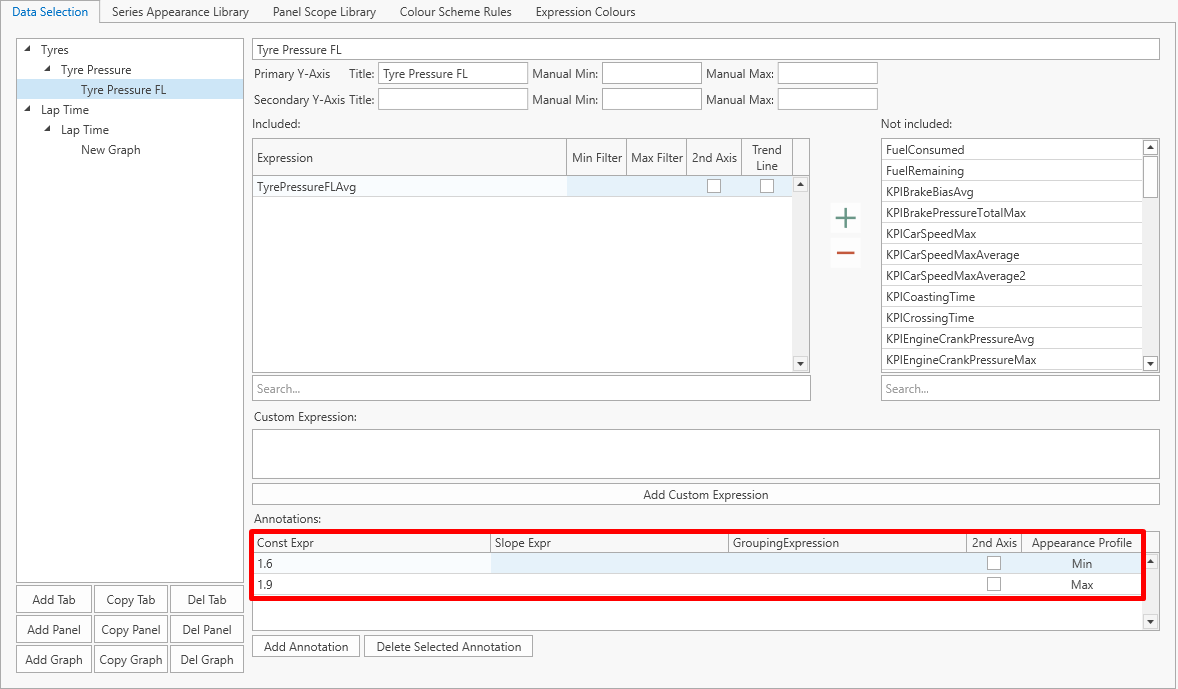
We have also added the ability to add annotations to box plot. Similar to what was available for a regular scatter plot.

Here is an example where we add minimum pressure and target pressure using the annotation:

Expressions for axis limit and filter

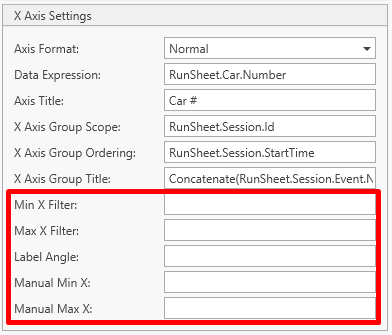
Previous to this version, only numerical values could be used to control axis min and max as well as any filter. Now, expressions can be used directly in the following cells:

Any expressions that returns a numerical value can be used. Moving forward we will work on having IntelliSense available for all those input boxes.

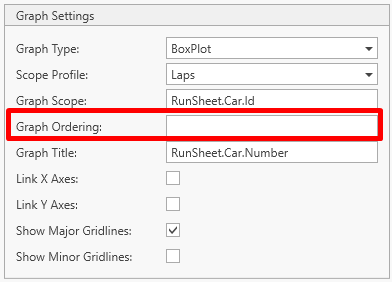
Graph scope ordering

Similar to the x-axis scope ordering, we have added a graph scope ordering.

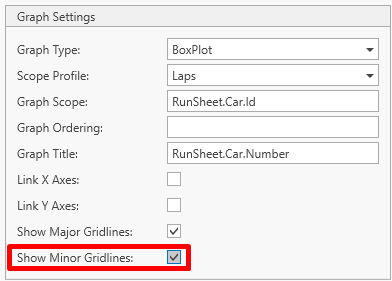
Minor gridlines

There is now an option to show the major and minor gridlines:

Excel export

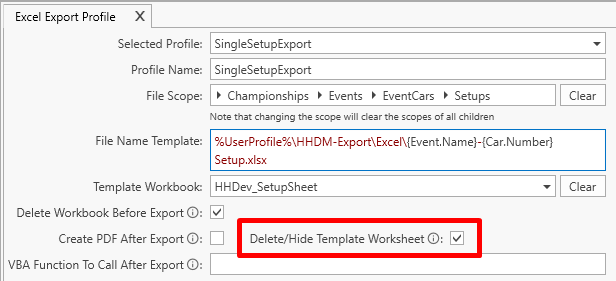
Delete/Hide template worksheet

A new option was added to delete or hide template worksheet following export:

Select where to export file option

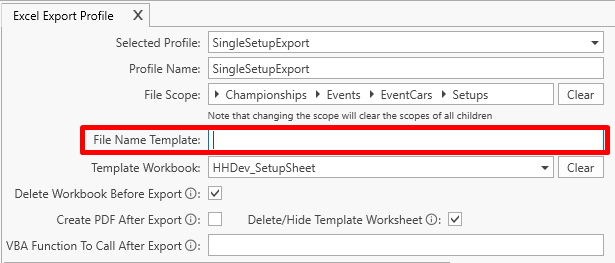
By default a file is exported based on the file name template. However if the file name template is left empty then the user will get prompted with a file selector window to choose the export location and the name of the file:

Options in Data Export

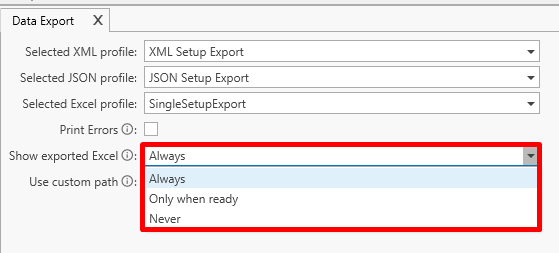
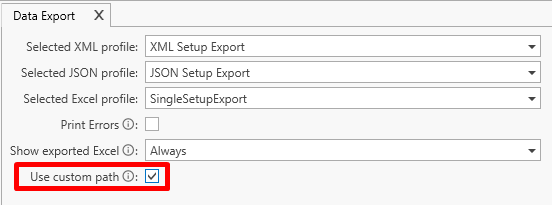
Two new options were added to the data export page for excel export:

  • option to pick if an Excel file should be shown or not when exported
  • use custom path - if checked this option will prompt the user with a file selector window to choose the export location and the name of the file.

CID Editor

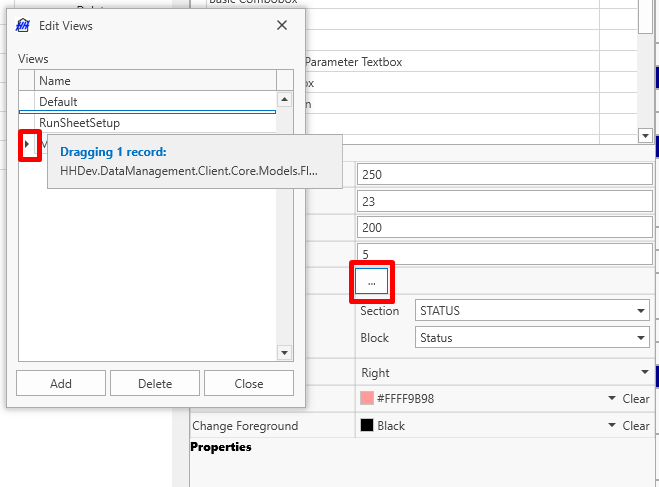
Ability to re-order the view order

We have added the ability to re-order views in the CID. This can be down from the CID Editor by dragging up and down the views:

Mileage

Data export

We have added two options from the Item Mileage page:

  • Save as Image that will export the pivot table as a png image
  • Export to Excel

Miscellaneous

Auto populate display names

Display names are now auto populated based on the parameter name everywhere in the software:

Display name can then be adjusted to be different than the name.

Image quality in CID

When displaying large image in a CID, the quality was quite poor in the past. Now the quality is not impaired.

· 13 min read

Version 23.2 includes many improvements to HH Data Management. Many of these were requested by you, so thanks for continuously sharing your feedback and ideas!

As usual, if you have any questions or issues with the release please contact us using support@hh-dev.com.

Installation

This major update brings changes to the database schema but this software will migrate the database automatically during its installation. Note that prior versions will not be allowed to sync anymore.

A resync of the database isn't needed and work on the account can resume immediately after the update.

caution

On the first start with this new version, the software will perform the database changes and it will take longer than usual for the software to start (<1min).

User Interface

Layouts

Two new features added for easier layout management:

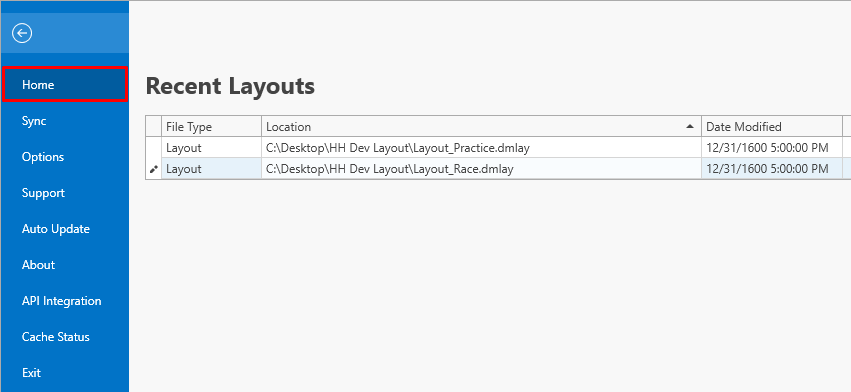
  • A recent layouts list in the backstage option:

The users can view all recent layouts used in addition to the location and the last modified time. Double-clicking on one of the items will load the specific layout.

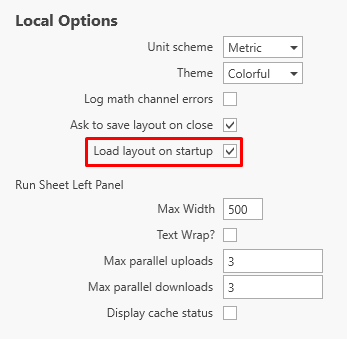
  • A checkbox in the local options of the backstage to load or not the most recent layout on start-up:

This option can be useful when working on different accounts or multiple projects within the same account.

Car View

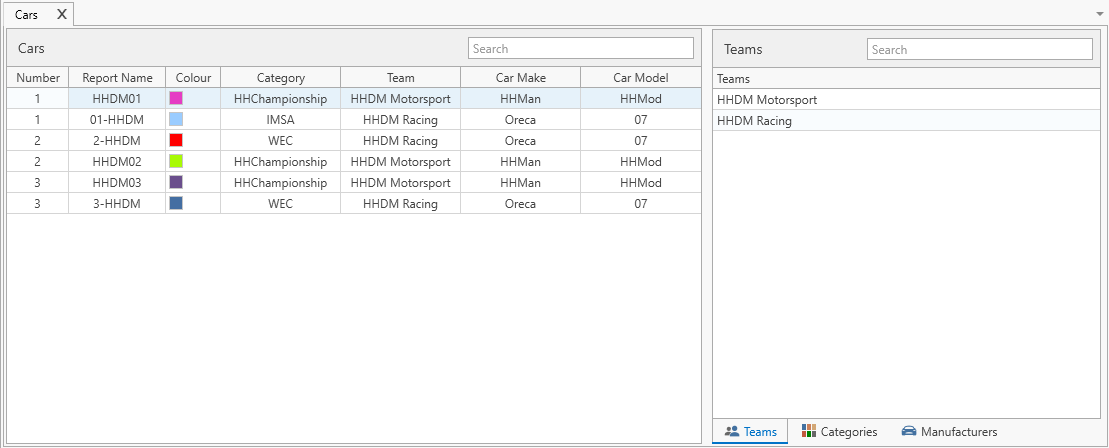
The car view was fully redesigned for an improved user experience:

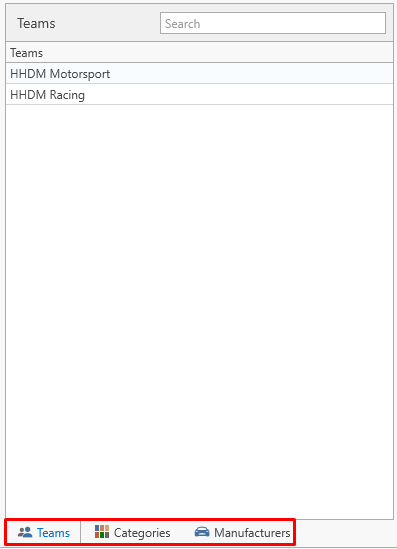
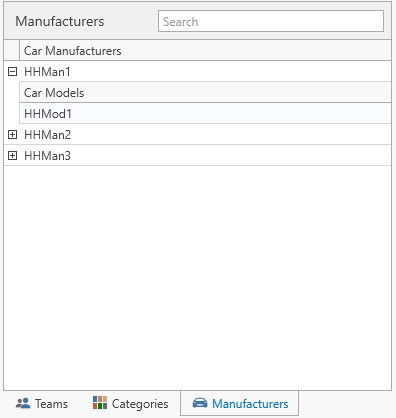
While the car table on the left of the page is still linked to a custom column like previously, Teams, Categories, and Manufacturers are now created on the right hand side of the page. Each section has its own tab:

The Teams and Categories are single lists whereas the Manufacturers is a parent-child type of list where the car model belongs to a Manufacturer:

Event Management

Similar to the Car view, the event management view was also redesigned to improve clarity.

On the left side, the different Events of a selected championship are displayed, and below each Event, the sessions for this particular event:

On the right side, the Car and Driver selection as well as the tyre specification selection, all have their respective tabs.

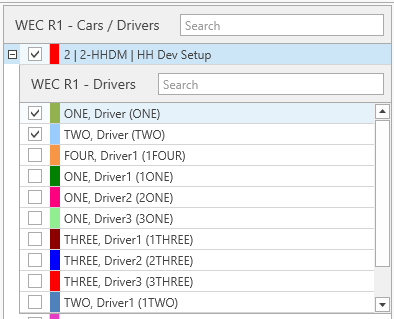
This is also where each car participating in the event can be selected with the drivers added beneath cars:

A color marker has been added near the car and driver names.

The filter on tyre specification is done under the tab Tyre Specifications.

Tyres

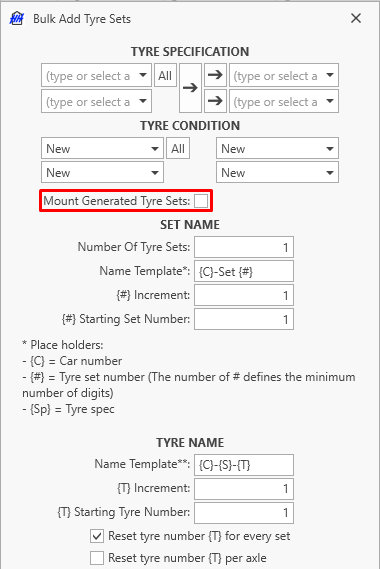
An option was added to choose whether a tyre set is mounted or not during the bulk import:

Run Plan

The Duplicate Run and Duplicate Lap buttons will now duplicate the selected run or lap instead of duplicating the last run or lap from the selected plan.

Job List

When printing the job list it will now only print jobs that are on the screen. Prior to this version, all jobs were being printed regardless of any filtering or if the completed jobs were being shown or not.

Parts

In addition to improving the number of syncing operations created when importing a collection, we have improved the user interface to import data into a part collection or a part item collection.

There are now 3 options to import data from an Excel file:

  • Table Map - This option is unchanged from previous versions. This is to import a 2D table by selecting the row, column, and cell parameters.
  • Column
    • Use Auto Mapping - This will automatically detect header columns and match them with HHDM parameters. This is also not changed from previous versions.
    • Manual Mapping - This allows the user to pick as many columns and link it to the specific parameters in HHDM

Mileage

Following the release of the first version of our mileage module at the start of the year, we have worked on adding some key features to it.

Initial Mileage

Two new parameters were added to each part item and assembly iteration definition:

  • InitialMileage of type Double (Length)
  • InitialHours of Type Double (Duration)

Those parameters store the initial mileage and hours for each part item and assembly iteration.

When creating a new part item the user will be able to enter both values directly:

Both values can be updated directly from the parameter list as well at any time:

info

Following changes to initial mileage or hours for any given part item or assembly iteration, the mileage calculation would have to be refreshed from the server to be taken into account.

Block session from mileage calculation

There is now the option to block a specific session type from being taken into account for the mileage calculation.

To do so, a parameter needs to be added to the Session Type definition:

  • IgnoreForMileage of type Boolean

The custom column for the Session Type profile needs to be modified to add the new parameter:

Item Mileage User Interface

We have added a few options to the Item Mileage user interface:

Ability to display the time used (hours) in addition of distance and laps

  • Ability to display the mileage table per:
    • Event - this was the original option prior to this release
    • Event/Car - to get an overview of which car used specific part items or assembly iterations
    • Session - to review mileage per session

Access mileage from maths and exports

We have added three new properties to the part items and assembly iterations to be able to use throughout the software (maths and/or export). Those properties represent the exact values pulled from the server and found on the Item Mileage user interface. The three properties are:

  • CurrentMileageDistance
  • CurrentMileageHours
  • CurrentMileageLaps

Exports

In the CID Editor, we have added two new cells:

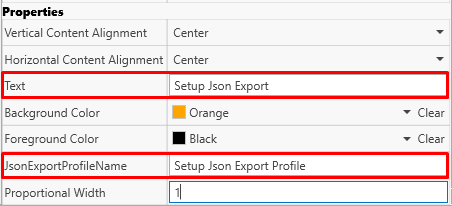
  • JSON Export Button
  • XML Export Button

Those buttons mirror the existing Excel Export Button and allow exporting JSON or XML files from the CID without the help of a plugin.

They both work by selecting:

  • a Text for the button itself
  • a Profile Name

Attached files

Overall improvement

In general, we have worked towards improving the experience with the attached files.

  • The download speed of files (especially of small size) is improved.
  • There is now a progress display both during upload and download.
  • Handling of attached files is greatly improved. For example, when a user unsubscribes from an event or when a file is removed from the server, the local attached files will be deleted.

CID Editor - Multiple Attached File display improvement

In previous versions, when using a multiple attached file display, it would display all attached files linked to an entity. We have added an option to only display attached files from the named attached file parameters.

This is done using the AttachedFilesGroupingName of the Multiple Attached File Display option in the CID editor:

In this example, there is an Attached File Parameters of type multiple under the setup definition called ResultSim:

In this case, in the setup, only the simulation results will be displayed in the control and not other attached files from the setup (pictures, config file, etc...)

Collection Items

Collection Items In previous versions, it was not possible to add attached file parameters to collection items. This limitation has been removed for this version.

Typical use case:

  • Driver rating collection items.
  • Scrutineering collection items.
  • Championship collection items such as fuel capacity, and fuel flow measurement.
  • ...

User Interface

On the Subscription page, we have added a button called Update Sizes. This button will provide feedback to the user on how big the local attached files for each event and event/cars are.

Weather

Timing feed data source

We have added a Timing feed measurement type to differentiate weather information coming from a weather station or from the timing feed. The selection will be done automatically.

As a reminder, there is an option to pick which data source to display on the weather graph.

Weather underground closest station

For users with an API key from www.wunderground.com, we have added an option to automatically find the closest station available.

The detection of the closest station will be done via the GPS coordinate of the track.

The following parameters need to be added to the track definition:

  • GPSLatitude of type Double.
  • GPSLongitude of Type Double.

The parameters can then be linked to the track table using the custom columns.

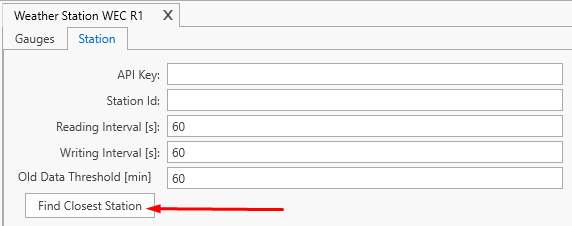
Finally under the Weather Station worksheet, when using the Weather Underground station type, there is a Find Closest Station button that will automatically detect the closest station available.

Math functions

Now() function

The Now() function was added following requests from customers to be able to timestamp exported files from the software.

  • The Now() function will return the date and time of day in the UTC time zone.
  • The time zone from an event can be passed as an argument so the Now() function can return the date and time in the event time zone. Example: Now(Event.Track.TimeZone). The exact expression will depend on the scope of use.
  • For formatting, the Now() function can be used in conjunction with the DateTimeToString function. Example: DateTimeToString(Now(Event.Track.TimeZone), "yyyy_MM_dd_hh_mm_ss").

CalculateChanges() function

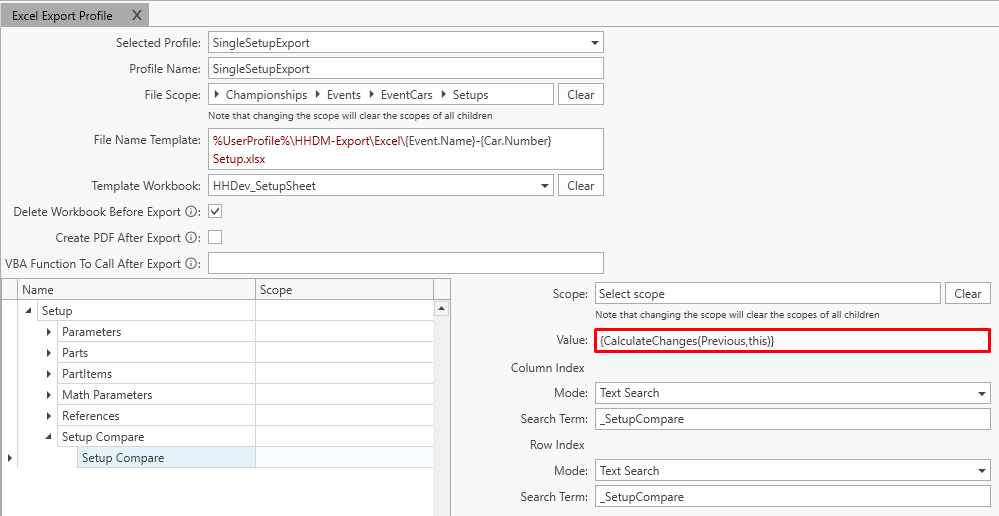
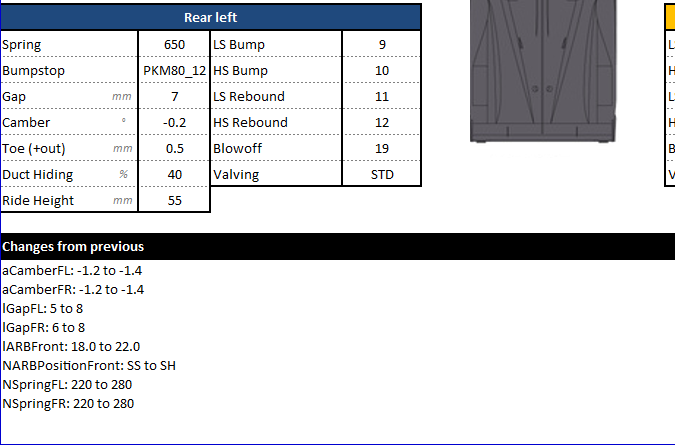
The CalculateChanges() function was added to be able to return the changes between two items in the software. One of the most common uses for the function would be to export the changes between two setup sheets.

  • The CalculateChanges() needs two arguments. The reference item and the current item.
    • For example, from the setup scope, the changes between two setups can be exported using CalculateChanges(Previous, this).
    • From the run sheet scope, it would be CalculateChanges(Previous.Setup, Setup).
  • The CalculateChanges() function will export the changes as a single text. Each item is on a separate line.

Collection operations

One feature missing in previous versions was the ability to do any math functions with collections. This led to the use of complicated functions such as Lookup, Order, etc... It is now possible to access a single item from a collection directly.

We have also added the option to use basic functions (Average, Min, Max, Sum, Count,...) directly with collections.

Here are a few examples of how this can be used:

  • From the Lap scope:
    • LapSectors[0].SectorTime will return the first sector time from the lap.
  • From the RunSheet:
    • Min(Select(Laps, "LapTime")) will return the fastest lap from the run sheet.
    • Average(Select(Laps,"KPI_TyrePressureFL")) will return the average value of a lap parameter over the full run.

Units

Two new units were added:

  • Quart (Volume).
  • N.m/rad (Rotational Stiffness).

Key Performance Indicators (KPI)

Data Files type

  • KPIs processing from Wintax files (unprotected files) is now implemented. To upload Wintax files, the run folder (the folder that contains all laps files) needs to be selected using a new button on the ribbon bar:

  • Improvement in processing Windarab files
    • Management of in and out laps.
    • Fix multiple issues with miscalculations due to the file format.

Data Analysis user interface

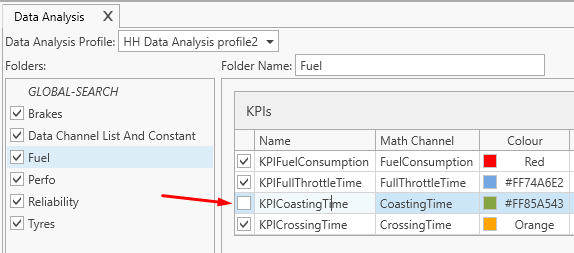
In the data analysis interface, there is now a checkbox for each folder, KPIs, and math channels. This checkbox allows or not for the calculation to be performed by the server. This can be useful when developing new KPIs for example or to speed up the KPI calculation in some situations.

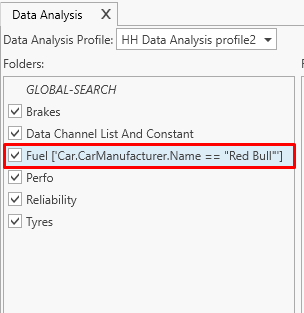
In addition to the previous feature, there is also now the option to edit the folder condition under which the folder's KPIs will be calculated or not. Here are a few examples of when this could be useful:

  • Different cars in the same account.
  • Different categories in the same account.
  • Different loggers between test and race.
  • Some sensors were removed for the race.

There is now a button called Edit Folder Condition in the ribbon bar to edit the condition.

The condition needs to be a true/false condition based on the RunSheet scope.

Folder conditions can be reviewed directly on the folder tree.

Other examples of conditions:

  • Car.Category.Name != "LMP2" - Only calculate for cars that are not from the LMP2 category.
  • Session.SessionType.Name != "Race" - Only calculate when the session is not of type Race.

RunSheet KPI management user interface

In the RunSheet KPI Management we have added a few extra buttons:

  • Save File As - Prior to this version, there was no way to save a file directly from this window.
  • Delete ALL files Remotely and Delete ALL Files Locally - Those allow the user to delete all files that were selected for a session.

Overall improvement

With more and more customers using the KPI feature, we worked on improving the overall experience:

  • The overall sync operations when running (and re-running) KPI's have been reduced.
  • Together with all the attached file progress we made in this version (see above), when a user uploads a data file, the data file is not stored anymore locally under the attached file folder of the software.

Custom columns

Duplicate option

First of all, we have added a duplicate button for profiles and for column definitions on the ribbon bar to save time when working on custom columns:

Different lap custom column for the run sheet

We had quite a lot of requests to be able to have different lap custom columns in the run sheet for different events, sessions,...

Some examples:

  • Road course vs Oval for Indycar
  • Sim session vs on-track sessions
  • Practice vs Race
  • ...

To be able to handle most cases, we have built a cascade priority list (similar to the lap markers) in the following order:

  • Session Car
  • Event Car
  • Session
  • Event
  • Track Configuration
  • Track

In the example of the Road course vs Oval, the selection should be done at the track level. But for the Sim vs On-Track, it should be done either at the event or session level.

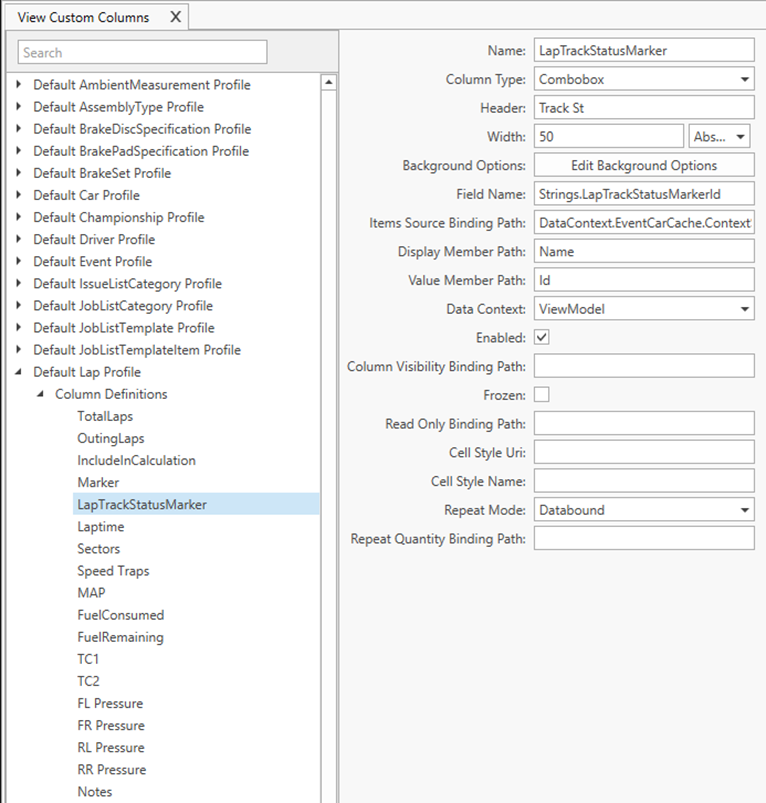
The following parameter needs to be added to the respective definition:

  • LapColumnProfileId of type Text.

The following custom column needs to be added to the respective profile:

  • Column Type: Combobox
  • Field Name: Strings.LapColumnProfileId
  • Items Source Binding Path: ContextSelection.SelectedManagementCache.ViewCustomColumnProfileCache.ViewCustomColumnProfiles
  • Display Member Path: Strings.Name
  • Value Member Path: Id
  • Data Context: **ViewModel

A selection of the lap profile will then become available.

· 5 min read

Version 23 is a major overhaul of the software. We made technological and structural changes that will allow us to continue improving the software following customers feedback. Security, performance, and customization were the main things we focused on.

Installation

Version 23 is a major update with changes to the database schema. The software should auto-update like previously. Versions prior to 23 will not be allowed to sync. Any work performed on those versions following the release of version 23 will be lost. When first starting the software on the new version, it will ask to delete the old database:

Please select Yes to continue. HH Data Management will then perform the initial sync. Once the pull operations are back at 0 you can resubscribe to your events.

Performance

Like for any major release, our focus was to review in detail every part of the software that can be improved for performance. For this version we continued to focus on the syncing performance as well as the loading data.

Custom Views

One of the most notable changes we have done for version 23 was the ability to create new views directly from the software. In the past the creation of those views had to be done programmatically from a plugin. Now they can be done directly from the Admin section of the software.

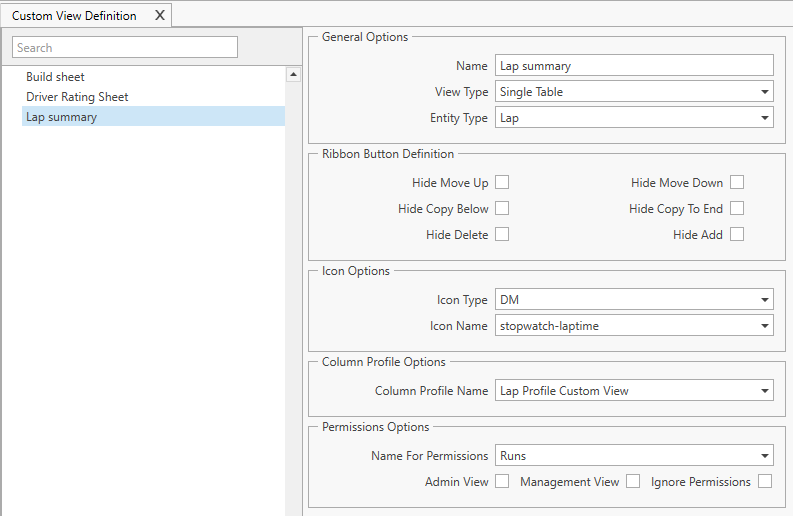
The custom view configuration page can accessed from the Admin ribbon bar:

Three types of views can be created currently:

  • Single Table
  • Multi Session Table
  • CID (Column Item Definition)

For each view, a new button will be created on the ribbon bar under a custom tab for the account.

For each view the linked definition, permissions, icons and other options can be defined:

This change will allow customers to display data in a format they choose and also manage data access. For example, only certain views from a setup sheet could be displayed for specific users of the account (for supplier for example). It will also a nice extension of the software with the ability to display any Column Item Definition from any definition.

Mileage and measurement

We worked on a first version of a comprehensive mileage and measurement module. This using assemblies and part item.

First of all, an overview of mileage for each part item and assemblies can be reviewed:

This mileage view is using our API to connect to the server to provide all information from the database. Once downloaded, all mileage for an event can be done locally.

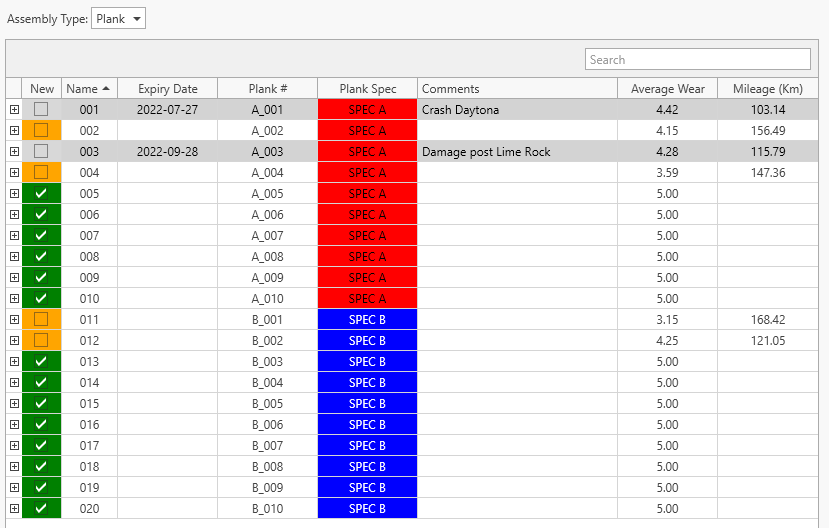
The assembly view can be used as an inventory and to track measurement and mileage:

Using custom columns, the assembly inventory can be filtered. For example to only see used items organized by a measurement calculation. An expiry date filed was added to the assemblies as well:

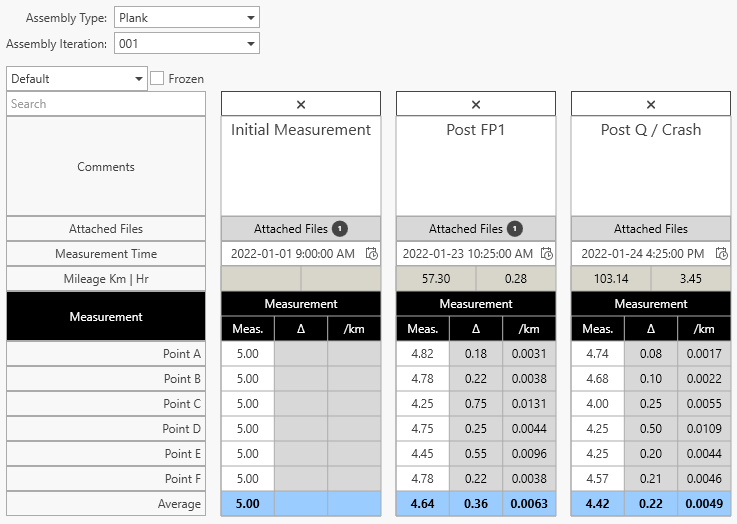
Assembly measurement can be customizable at the inventory level:

And the measurement can be also defined as custom column definition to provide flexibility to display any calculation needed:

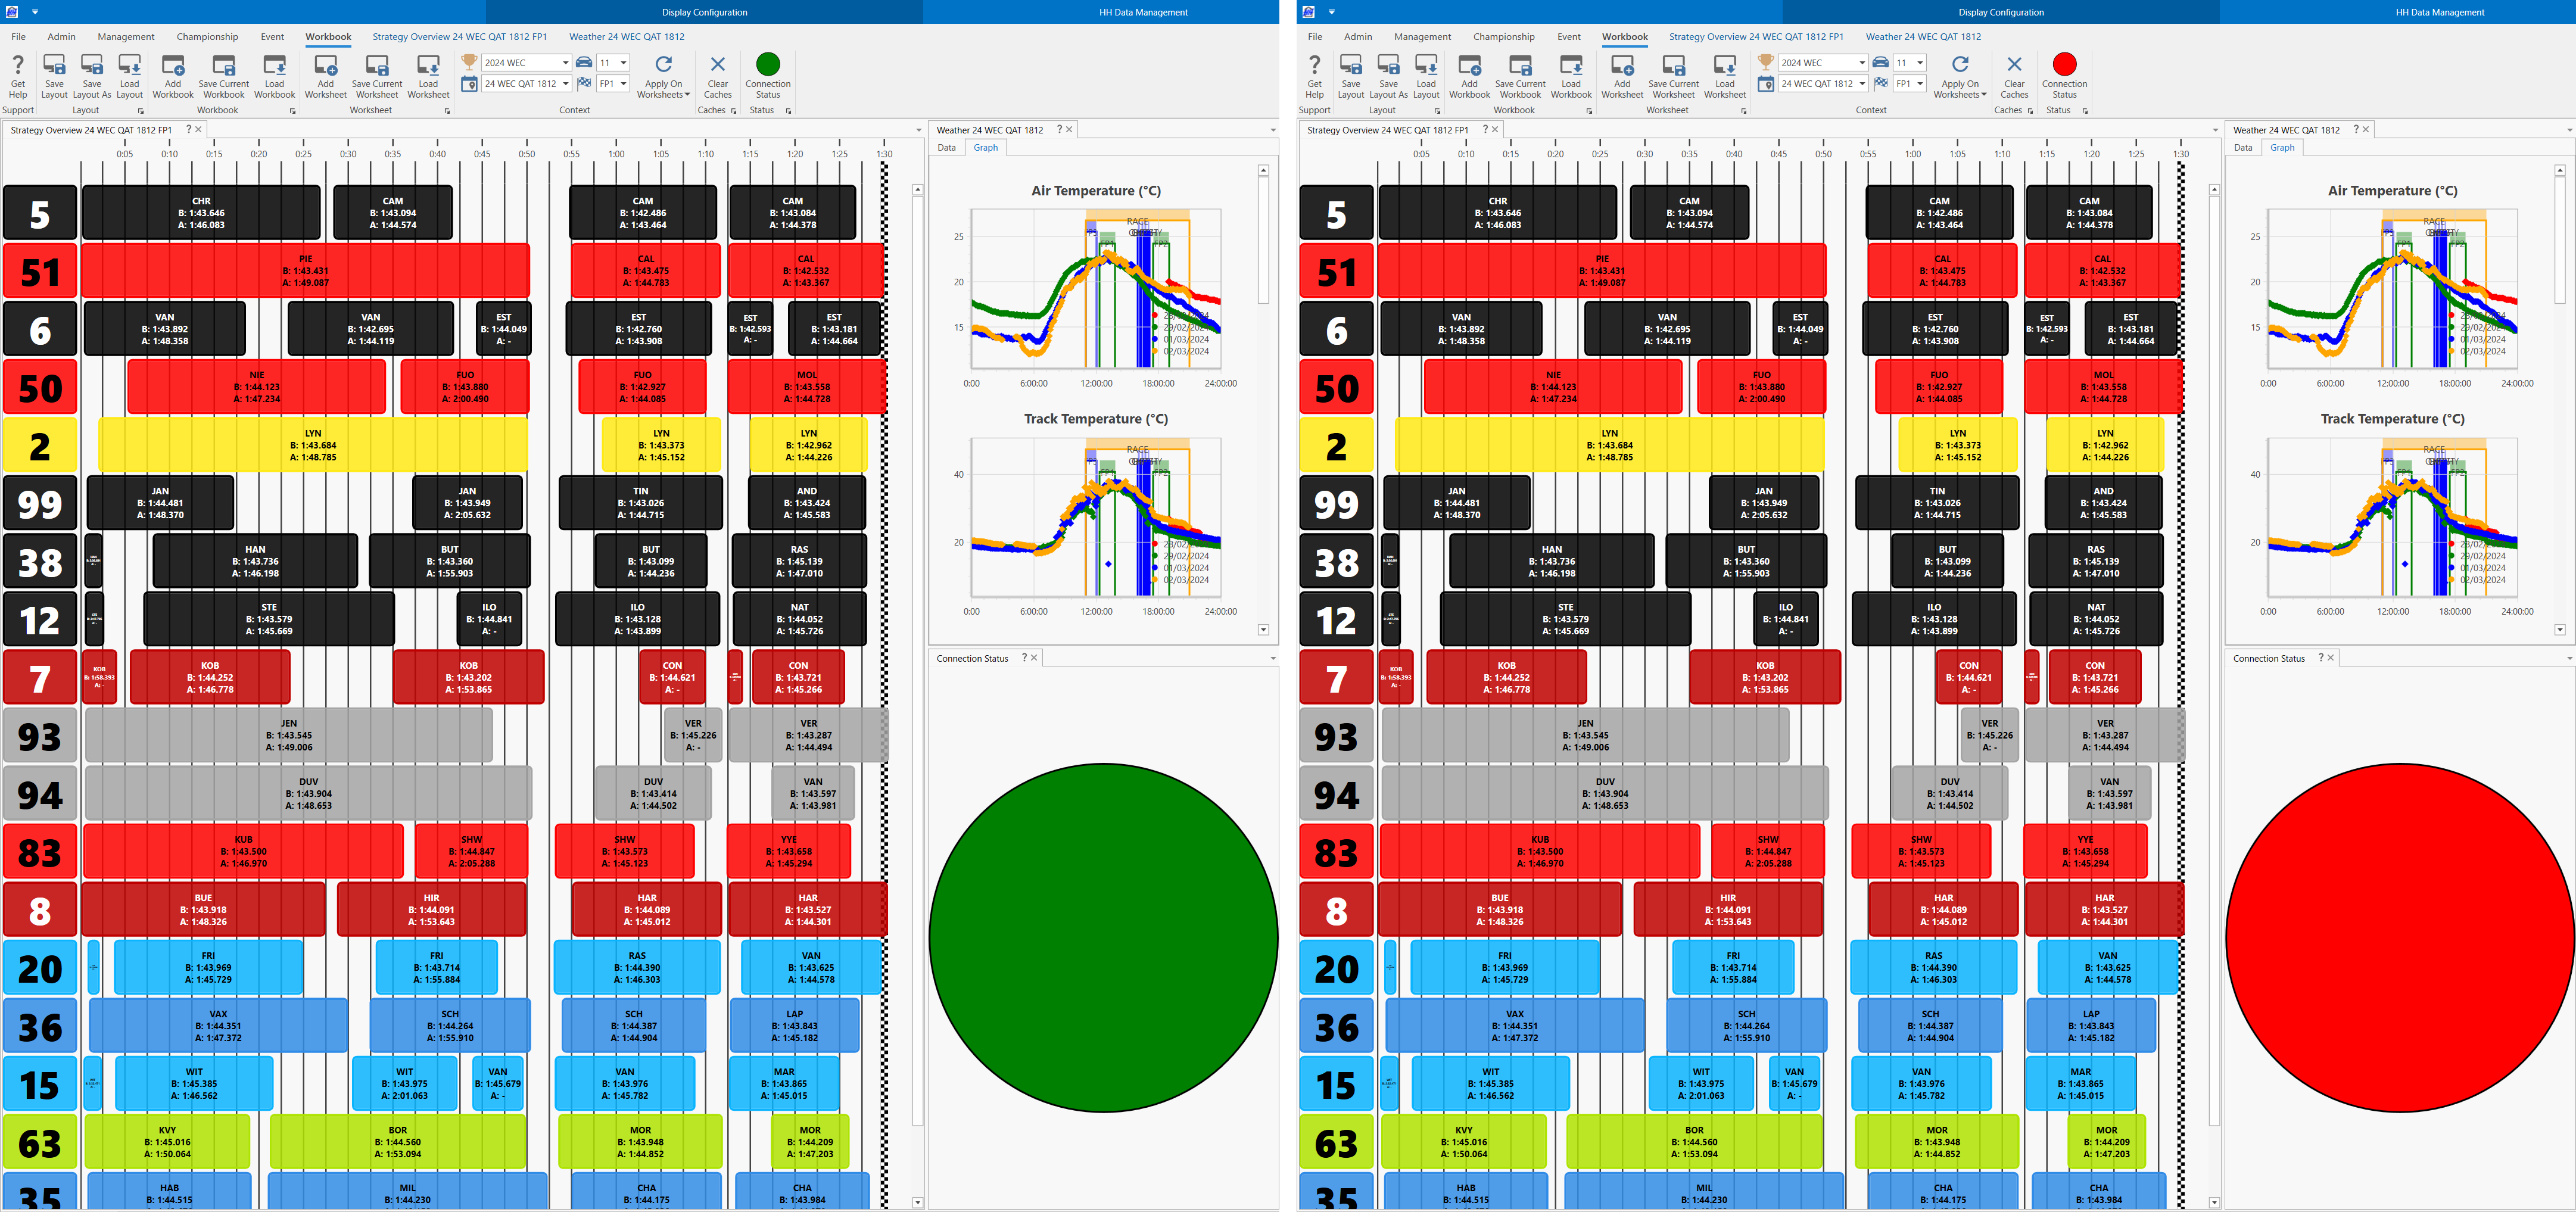
Strategy Overview

A strategy overview control was added in the event part of the ribbon bar:

It allows to have an graphical overview of a specific session:

Color options and text options allows to configure it. For example, colored by driver and displaying the cambers for each run:

Column Item Definition improvement

We have changed the syncing of the column item definition editor to use the regular syncing framework. The old method used was limiting development of the software in this area, especially for sharing of information.

We have also redone the formatting options of the Column Item Definition Editor. It is now a lot more comprehensive and allows for better customization. For each style option (Background color, Foreground color, Font weight, Font style, Font size and Read only), we can now define either a constant value, an expression or link it to a custom property.

Definition UI Improvement

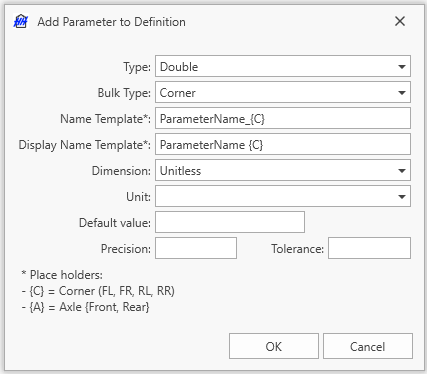
We added the option to add parameters in bulk using either Corner or Axle:

We also added the ability to delete multi parameters at once.

JSON Export

Very similar to the way that we added in the past the ability to export data into excel or xml files, we have now added the ability to define a JSON export profile. A JSON file is a file that stores simple data structures and objects in JavaScript Object Notation (JSON) format, which is a standard data interchange format. JSON files are lightweight, text-based, human-readable, and can be edited using a text editor.

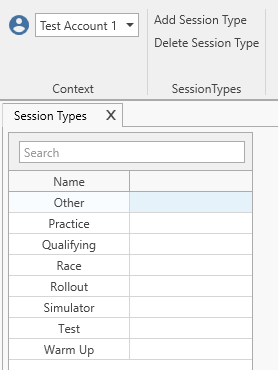
Session Type

Session types are now stored in the database and accessible by the users under the admin section:

Website and API

Due to the increase of API usage in 2022, we have worked on increasing the permissions granularity of the API. Previously, a user with an API key would have access to the entire admin and management part of an account. Also there was no way to restrict permission to certain parameters or definition.

Now the permission for the API can be defined at the parameter level if necessary. The permission can also define if a user can create, read, update or delete a parameter, or a full definition or entity.

The permission on the website were re-worked to take this change into account.

This new structure allows to differentiate between the worksheet rules and the data access rules.

What is coming next?

Following the release of version 23 we will focus in the early stage of 2023 to release some of the new UI we have been developing using the database scheme:

  • Improvement to the Main Graphs
  • Improvement to mileage and measurement

· 12 min read

Version 22 is a major overhaul of the software. We made technological and structural changes that will allow us to continue improving the software following customers feedback. Security, performance, and customization were the main things we focused on.

Installation

Version 22 is a major update with changes to the database schema. The software should auto-update like previously. Versions prior to 22 will not be allowed to sync. Any work performed on those versions following the release of version 22 will be lost. When first starting the software on the new version, it will ask to delete the old database:

Please select Yes to continue. HH Data Management will then perform the initial sync. Once the pull operations are back at 0 you can resubscribe to your events.

Performance

Like for any major release, our focus was to review in detail every part of the software that can be improved for performance. For this version we focused on the syncing performance and loading data. Here are some of the numbers we found performing some benchmark:

  • Initial sync time --> Reduced by up to 65%
  • Subscribing to event time --> Reduced by up to 90%
  • Loading event time --> Reduced by up to 46%
  • KPI running time --> Reduced by up to 73%

The server also received improvements to perform actions we struggled to accomplish in 2021 on larger accounts/events.

Local database location

We have moved the client.db local database to a safer location to avoid any interference with other syncing tools such as One Drive or Dropbox.

By default, the local database will be under the location %localappdata%\HH Development\HH Data Management.

Plugins and attached files folder will remain in their current location Documents\HH Development\HH Data Management.

info

Customers currently using the custom directory file to change the location will not be impacted by this change.

Custom definition and custom column

One of the most notable changes we have done for version 22 was to move most of the default properties in the software to custom properties. In the past it was sometimes challenging to navigate between the two. This will allow a much easier workflow when working on math parameters and designing new views in the software.

Thanks to this change, every column for every table in the software is now defined directly within the software. The custom column section was used only to add custom columns in the past whereas starting with version 22, all tables are fully defined as custom columns:

This change will allow customers to modify how the data is presented in the software without having to use custom code.

User interface

A link to the account management website is handy to access software download, user creation and management.

Standardization of re-ordering items in a table

Re-ordering items in a table was challenging in the past with some cells allowing drag and drop while some others didn’t. We have decided to move the drag and drop location on every table to the far left only to improve usability.

Improvement to validation throughout the software

We experienced some issues when switching runs for example without validating a comments section for example. We have improved the validation mechanism throughout the software to avoid any more involuntary data loss.

Improvement to change tracking – Usage of tolerance

Prior to this version, the change tracking between two parameters was either ON or OFF. If we take the example of the camber angle there is always a small difference between the camber required by an engineer and the camber achieved by the mechanics on the setup pad:

Starting with version 22, we can define a tolerance for each parameter in the definition. For example, for the camber parameters we can define a tolerance of half a tenth of degree:

With the tolerance in place, only changes above the tolerance will be shown with the change color:

Backstage option

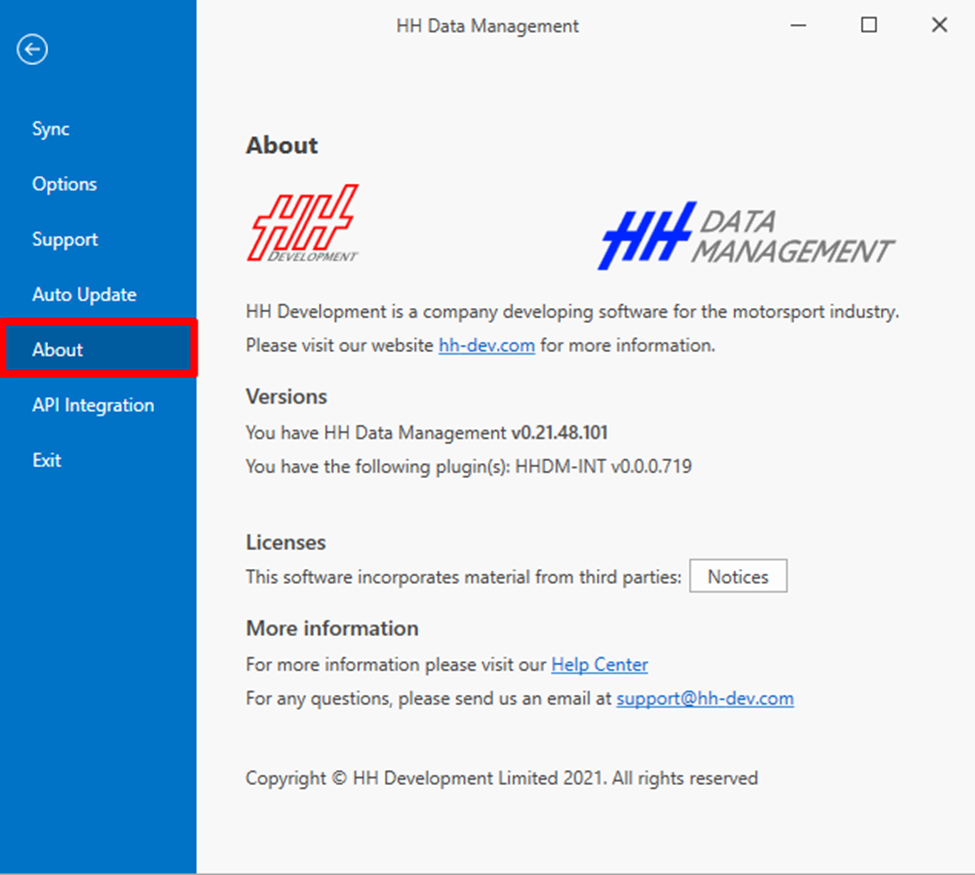
We have added a new "About" page in the backstage option. The main goal is to have access to all the important link for support as well as a summary of the software and plugin version in use.

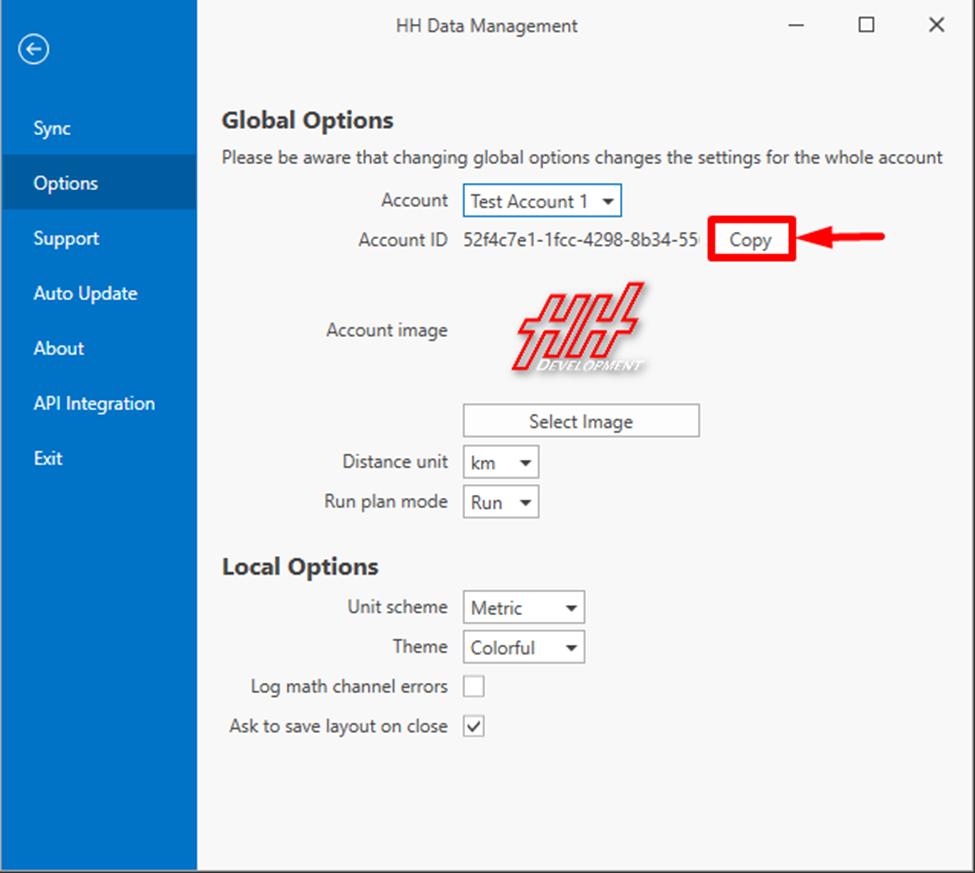
In the global option, we can now copy the account ID to the clipboard. This can be quite helpful when using the API for the first time.

Color option for lap and track status markers

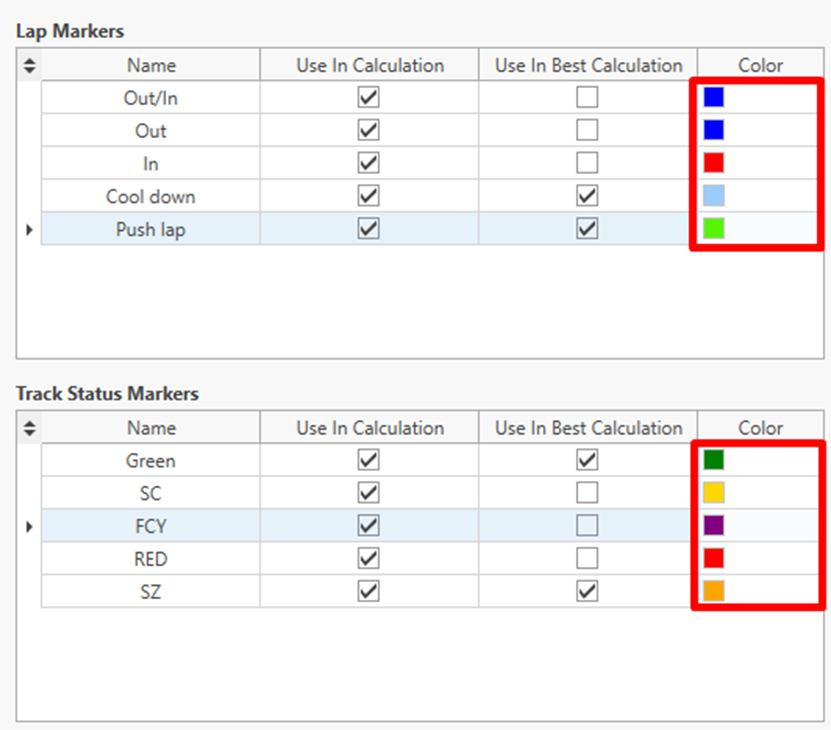
We can now change the background color for all lap and track status markers. This is done at the account level under Admin Lap Markers

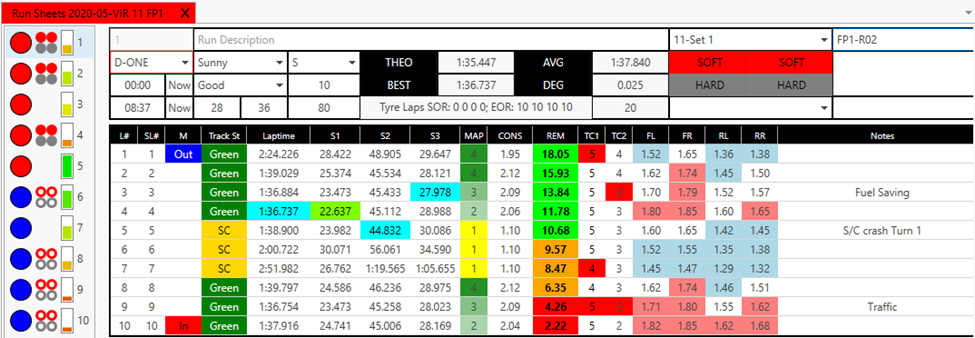
The background are then in use in the run sheet and run plan.

These columns are defined in the column customization, and so can be modified by users if you wish to revert this change.

Comments for tyre pressure entries in tyre set sheet

Prior to version 22, it was impossible to edit the comments directly from the tyre set sheet. Now it is possible which helps a lot with information regarding tyre pressures:

Setup change formatting

Before version 22 all setup changes were displayed in the software. It was sometimes challenging to track changes between setup in an organized manner. Over the years we have worked on different solutions by doing custom codes in plugins. We have decided to make all options available in the software.

Here is an example of setup changes. In this case, we added some comments and changed camber and ride height on the setup sheet.

Under Admin Change Formatters, we now have 4 options that can be used to help format the setup changes.

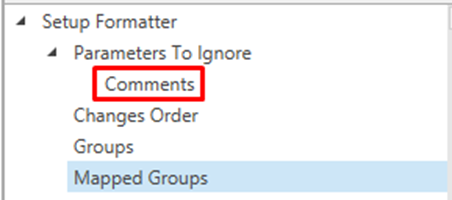
The first option is "Parameters to Ignore". In this case, we will decide to ignore the "Comments" from the setup changes:

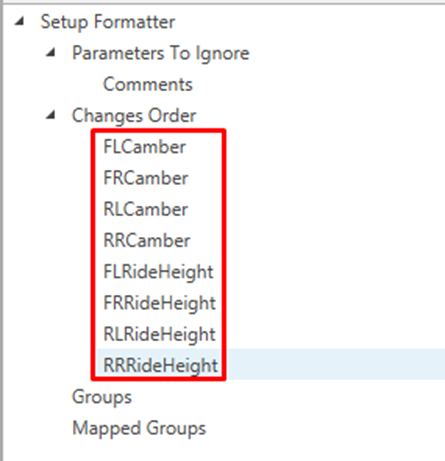
The second option is "Changes Order". By default, the setup changes will be listed alphabetically. We can now re-order items:

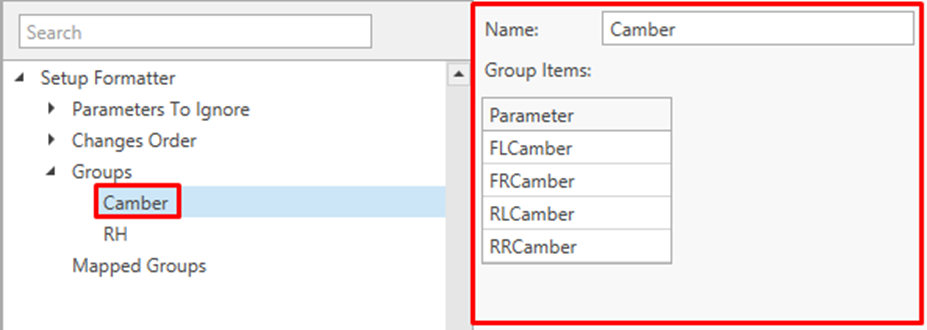
The third option called “Groups” gives us the ability to group some parameters together. For example, we would like to see all Cambers on one line and all ride height changes on one line:

The last option called “Mapped Groups” allows to display another parameter as a substitute to a group. For example, for the ride height it might be more useful to display the rake rather than the actual ride height measurement of all 4 corners.

With Rake being a Math Parameter on the Setup definition:

We now have the final setup changes formatting in a way that is a lot easier to review and use:

Security

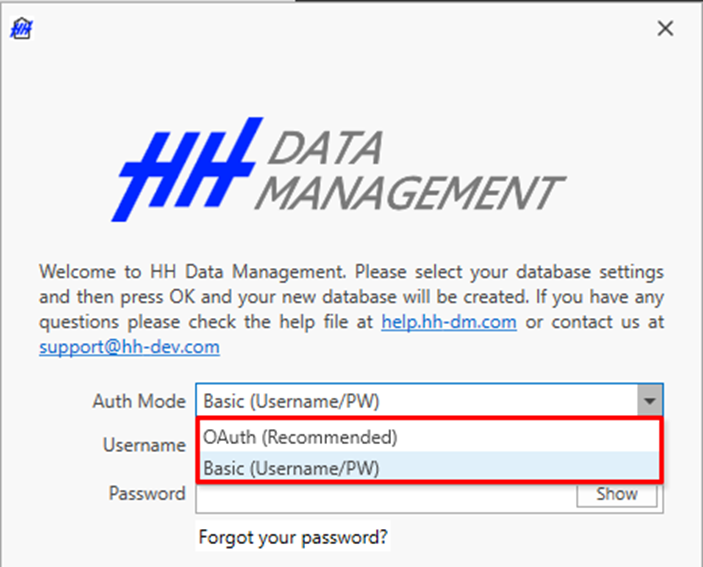
You will notice when starting HH Data Management that the login screen has changed slightly.

We have added a new authentication method called OAuth following industry standards. This new method will be in Beta test for the first part of the 2022 with the idea to use it as the default authentication mechanism in the future. We are excited to bring this change as it will let us implement additional security options in the authentication mechanism such as multi-factor authentication as well as providing better integration with the API.

Math functions

Previous and Next

The previous and next function can used to do any calculation for any entities using values from the previous and next. For example, in a setup, you can access the setup from before and after. If you want to calculate the delta change in camber you can do:

FirstNotNull function

The FirstNotNull was added to simplify cascade calculations that were required in some case. Let’s take the case of default fuel consumption. It can be defined for each run sheet or at the event level. To detect the fuel consumption to use in any calculation we can now create the following function:

This math function will return the fuel consumption for the run if it is not null. If it is null, then it would return the event average fuel consumption.

Another example could be for KPI calculation in the case of using a beacon offset for any calculation. The beacon offset could be defined at the track configuration level, the event level or the session level. By using the FirstNotNull function, the KPI can detect the correct offset to use for the calculation:

Lookup function

The Lookup function is an advanced function that allows to locate a single item from a list. For example, this can be used to get access to tyre specification properties from the setup sheet. In this case the tyre stiffness:

Assemblies

In a bid to improve part management and tracking of components we have developed a new layer called assemblies. Prior to version 22, any components would have to be assembled on each setup. With assemblies, components can now be grouped in iterations per championship, event or linked to a car. The user can then select only the assembly iteration per setup instead of each components individually.

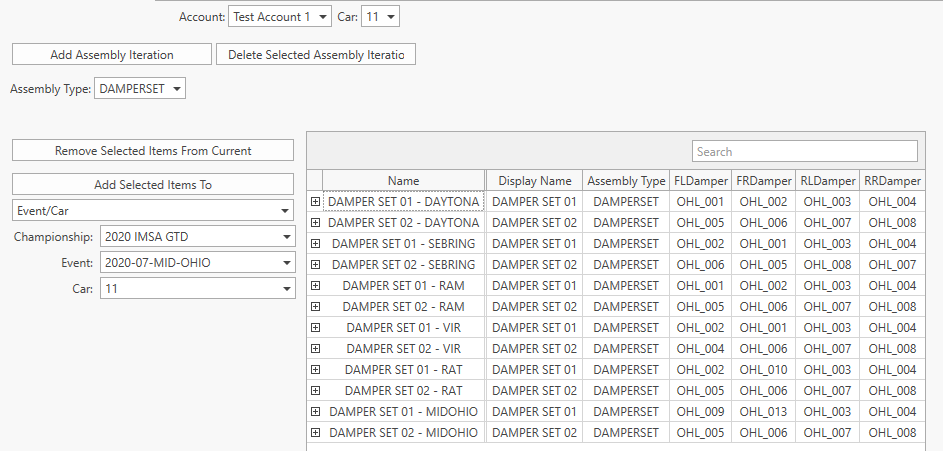
Let's take the example of a team that brings 2 damper set per car per event. The damper set for each event can be build in an inventory:

Similar to the tyre inventory, assemblies iteration can be managed between events.

In the column item definition, we have added an assembly selector. The selection can be filtered by all iterations or only iterations per championship, cars or events.

In the background, HH Data Management keeps track of the usage of each components individually.

Attached files in CID

In version 22 we have added the option to add attached file to the column item definition.

Multiple attached file display

For each CID like a setup for example, you can add a button and see a summary of how many files have been uploaded to this particular setup. To upload or download files, a click on the button opens a regular attached file window.

It is a great addition to be able to store any pictures or relevant files linked on a specific setup or any CID entity.

Single attached file display

The single attached file display can be used for different purposes. It can be used for example to store a config file for a specific CID or to allow the display of a setup procedure.

Here is an example of a drawing explaining how to measure the underfloor points of the car. It can be just a button to open the picture on one line:

But if setup over multiple lines, a thumbnail of the picture will be shown:

Files can be linked to any entities in the software ( Car model, category, event, championship, etc...).

Key Performance Indicator (KPI)

Quite a few changes have been done on the KPIs on version 22.

Unit handling for KPI math channels

Intellisense for KPI math channels

Custom Expressions

Custom expressions are replacing the SetupSheet and RunSheet function. This feature makes it possible to access any properties from a lap scope. For example, a setup parameter, the fuel consumption or the track length.

Data Management Integration (DMI)

With version 22, the integration between HH Timing and HH Data Management will require the installation of the latest HH Timing and well as the latest DMI.

info

Latest versions

To allow us more freedom in the data transferred between the two software and improve the performance, we have switched the server mode of the DMI to use our API. The local mode stays unchanged.

The user interface is slightly altered in both the backstage options and inside the software.

The authentication can be performed using the OAuth method or an API key.

The choice between Local mode or API mode is now done directly within the software and it can be changed without restarting the software.

Another improvement in the DMI is that we are now sending session and day time to HH Data Management from HH Timing which will make it possible to do actual timing analysis in HH Data Management that could otherwise only be done in HH Timing.

API

Along with version 22 we have released a new API. We improved the speed by adding compression to all the response bodies.

Following comments from users, we have also improved the parametersToInclude parameter so that it can be used to select the child parameters to be included. For example, when retreiving all championships and events from the Championships endpoint, if you want only the name of each championship and event, you can provide this parameter like "Name,Events.Name". This helps to reduce the volume of data transferred which will help with the performance of client applications.

What is coming next?

Following the release of version 22 we will focus in the early stage of 2022 to release some of the new UI we have been developing using the database scheme:npm run build

  • New issue list module with new workflow
  • New graphing interface
  • UI upgrade to the Data Analysis page
  • Improvements to mileage tracking for tyres, brakes, parts and assemblies