Main Graph Introduction
The goal of this article is to present a walkthrough for the main graph to show how a simple lap time vs lap number graph can be created. For a more detailed explanation of how all the features work please refer to the documentation.
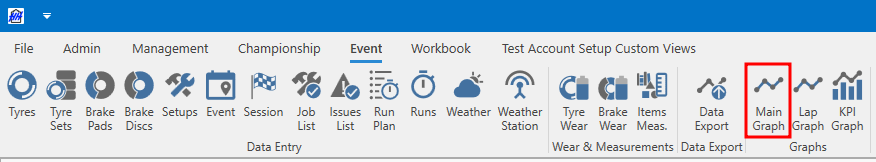
Open the main graph, which can be found on the Event tab of the ribbon bar:
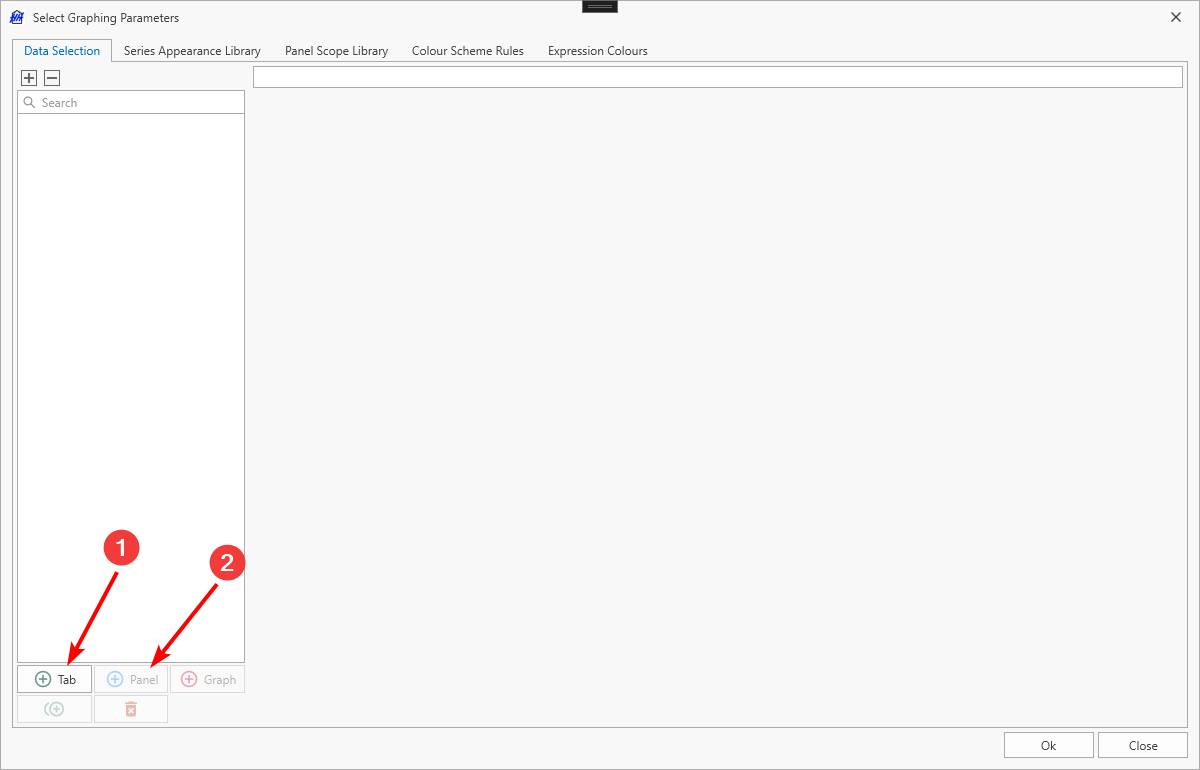
Edit graphs window
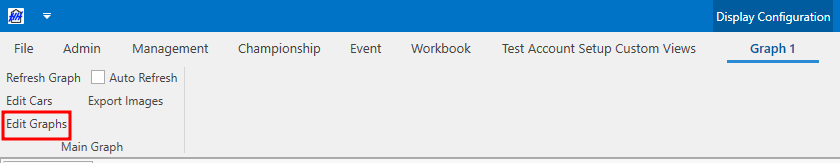
To start creating a graph, click the 'Edit Graphs' button:
Create a tab, and child panel
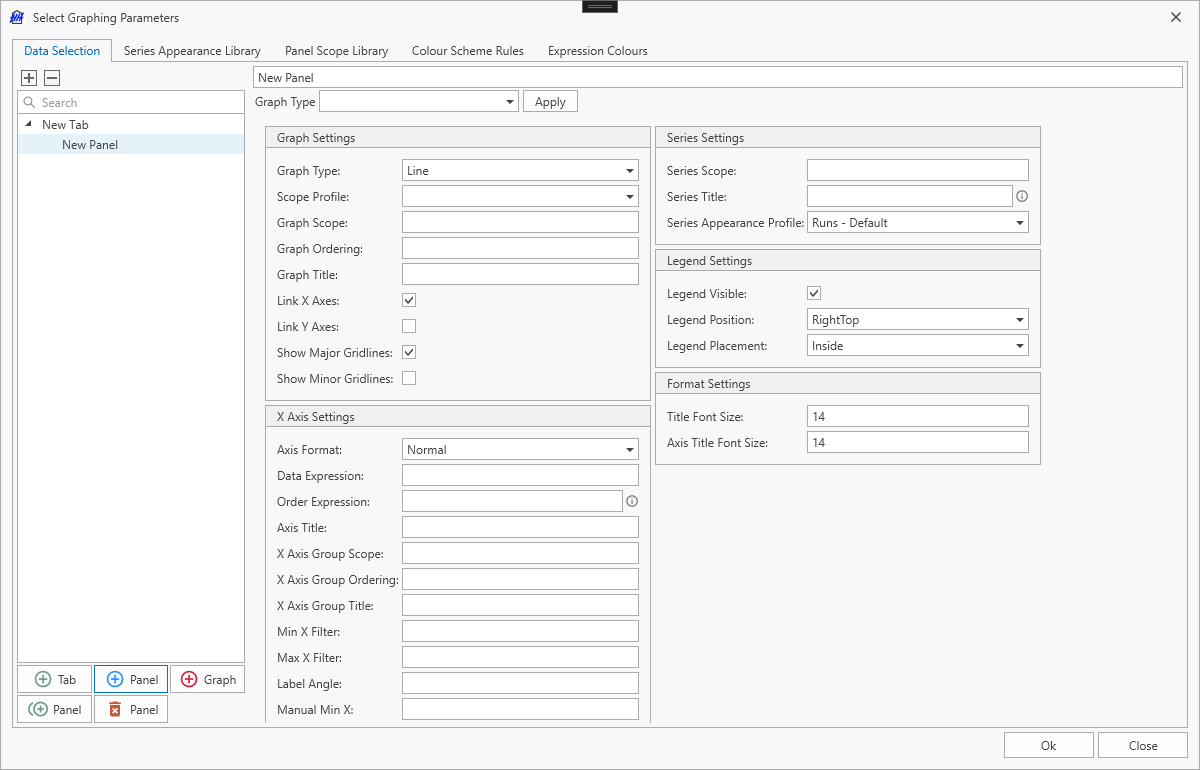
The edit graphs popup window will now look like this:
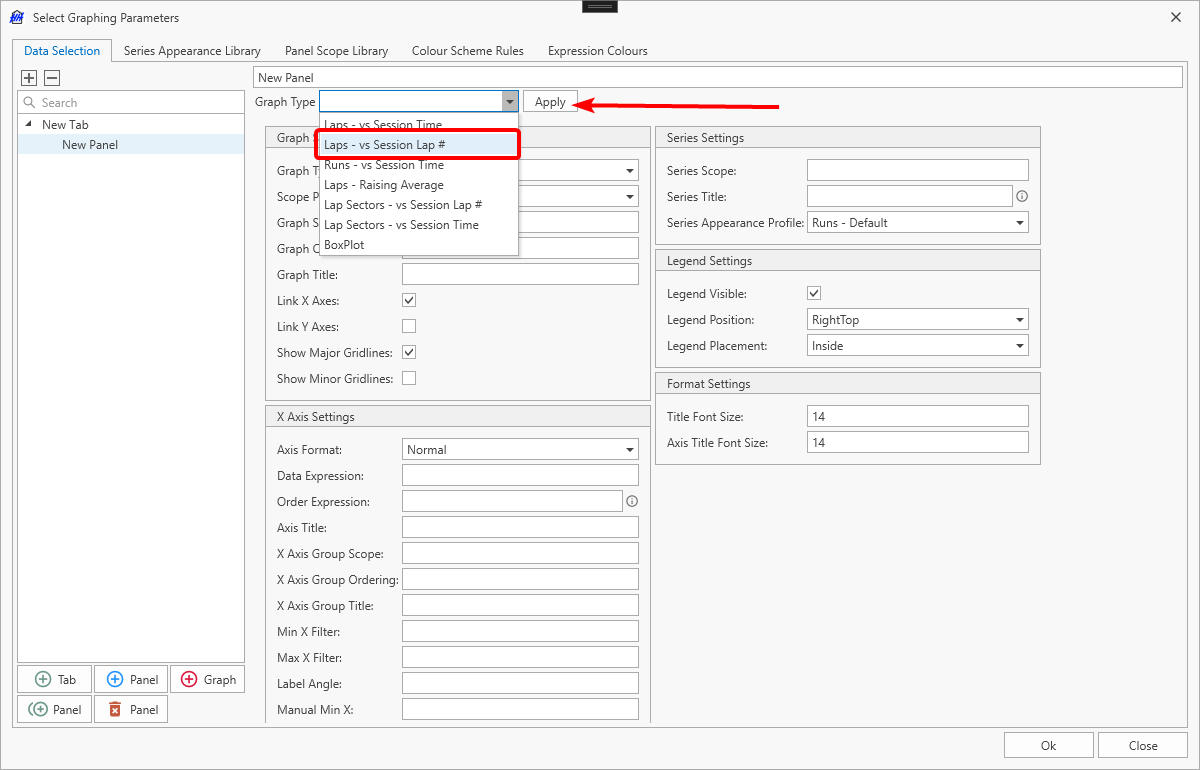
Graph type templates
To speed up the graph creation process, there are preset graph types to choose from in the Graph Type dropdown. Select Laps - vs Session Lap # from this dropdown, then click Apply:
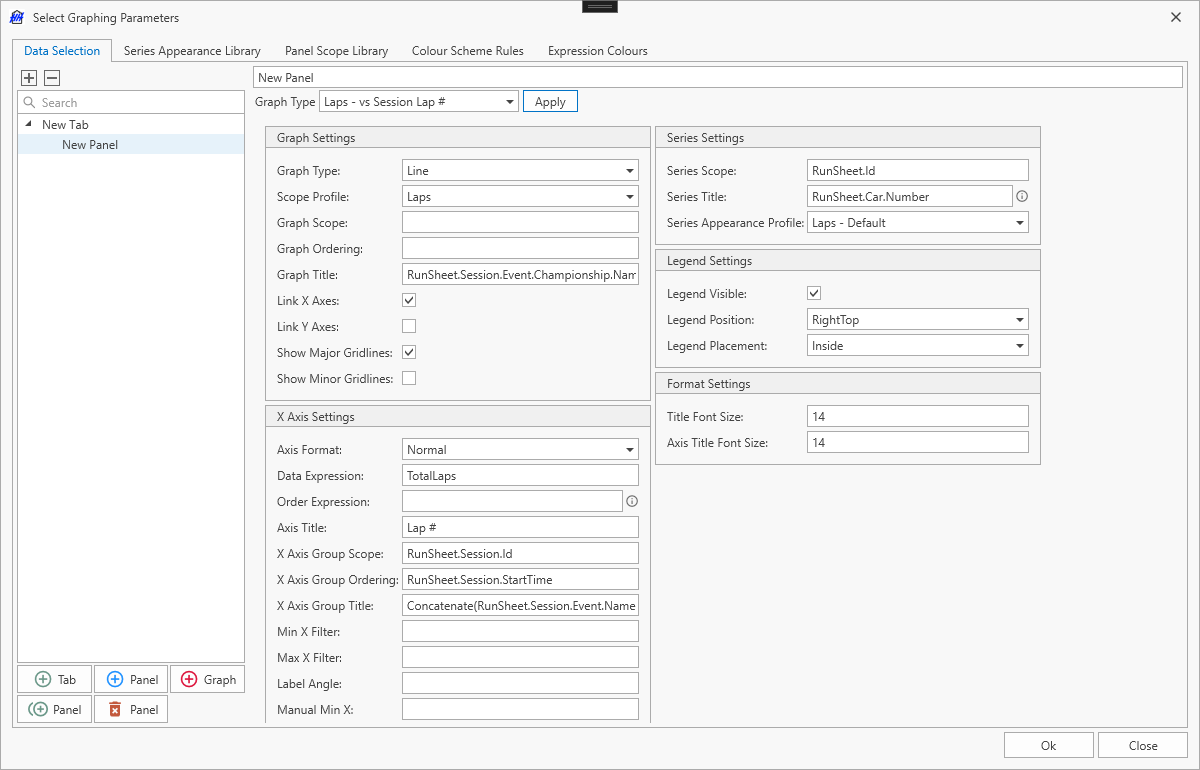
This will populate the following fields:
Selecting data to show on the graph
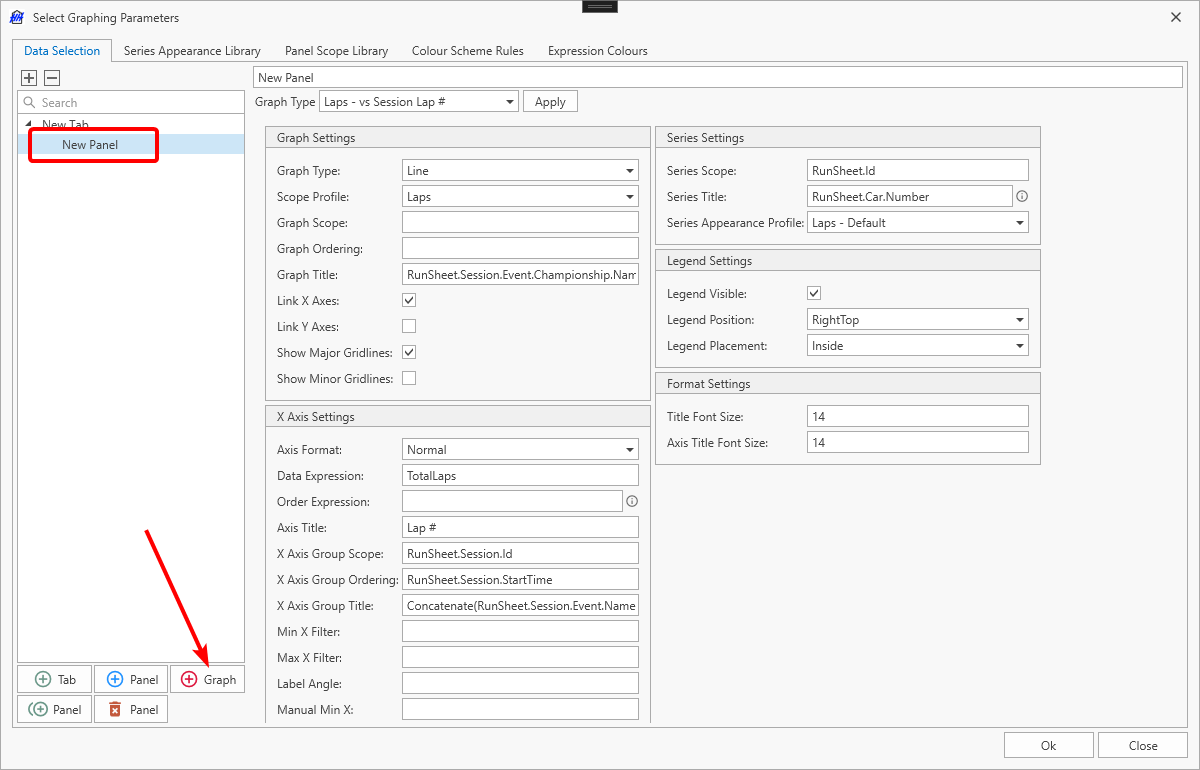
With the New Panel selected, click Add Graph to start defining the graph:
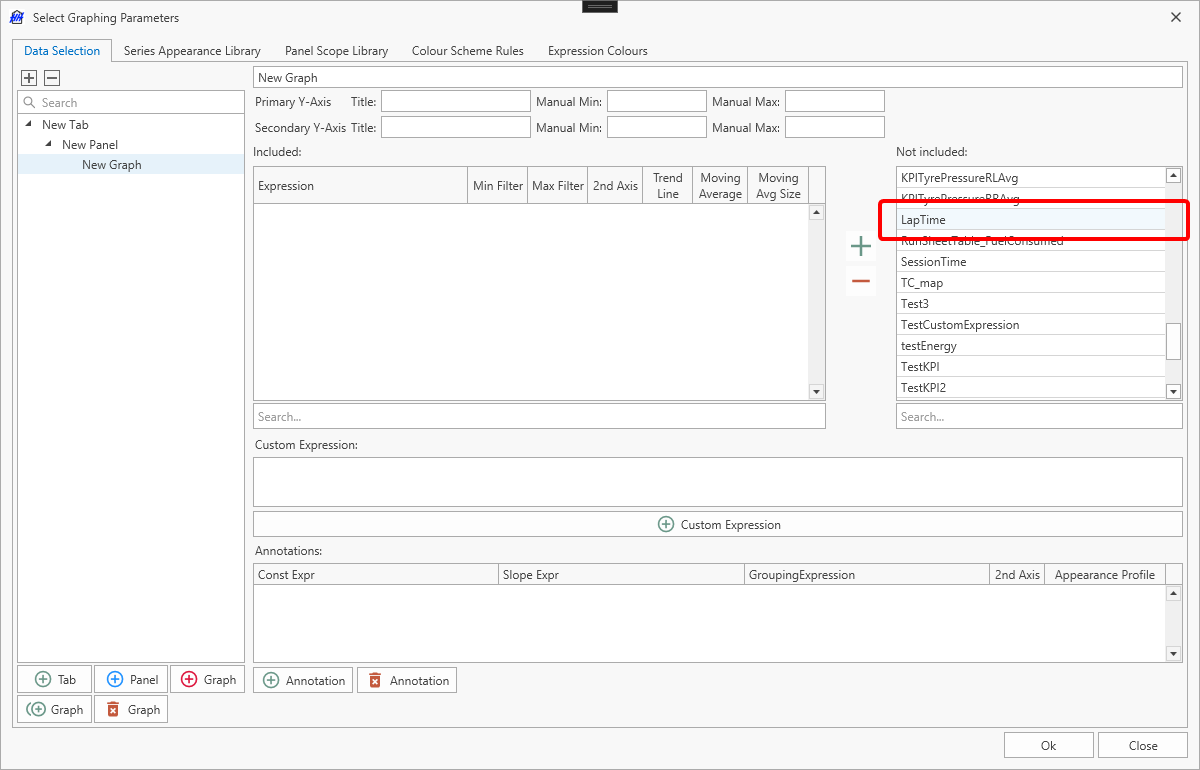
Select the data to graph by scrolling through the list of parameters on the right, find 'LapTime', and double click it to graph it:
The Y axis is labeled by entering 'Lap Time (s)' like below:
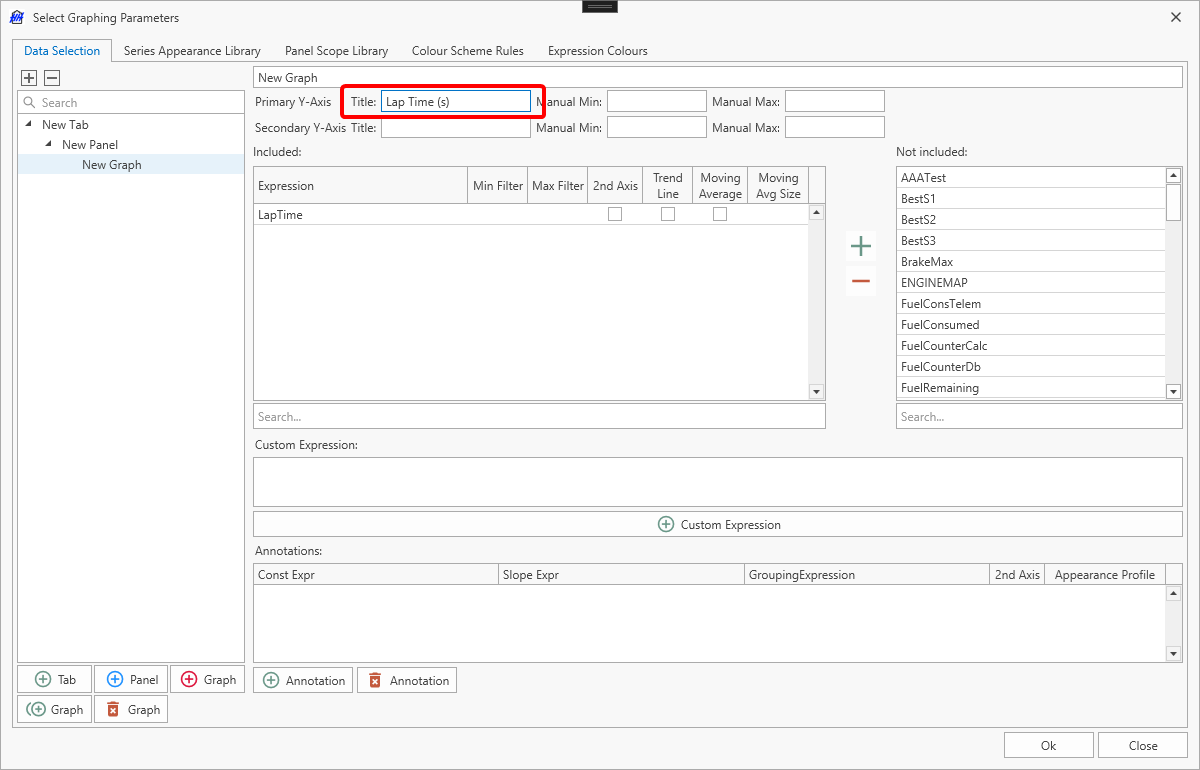
Clicking 'Ok' will save the changes and close the graphing popup.
Selecting cars
However, before a graph is drawn, Main Graph needs to be told which cars to graph. Click the 'Edit Cars' button in the Ribbon Bar, select the desired cars in the ensuing popup, and click 'OK' (this view will vary depending on the account):
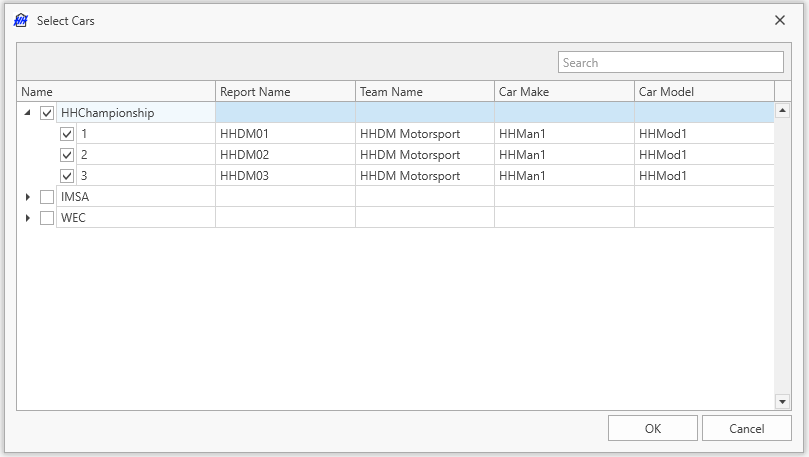
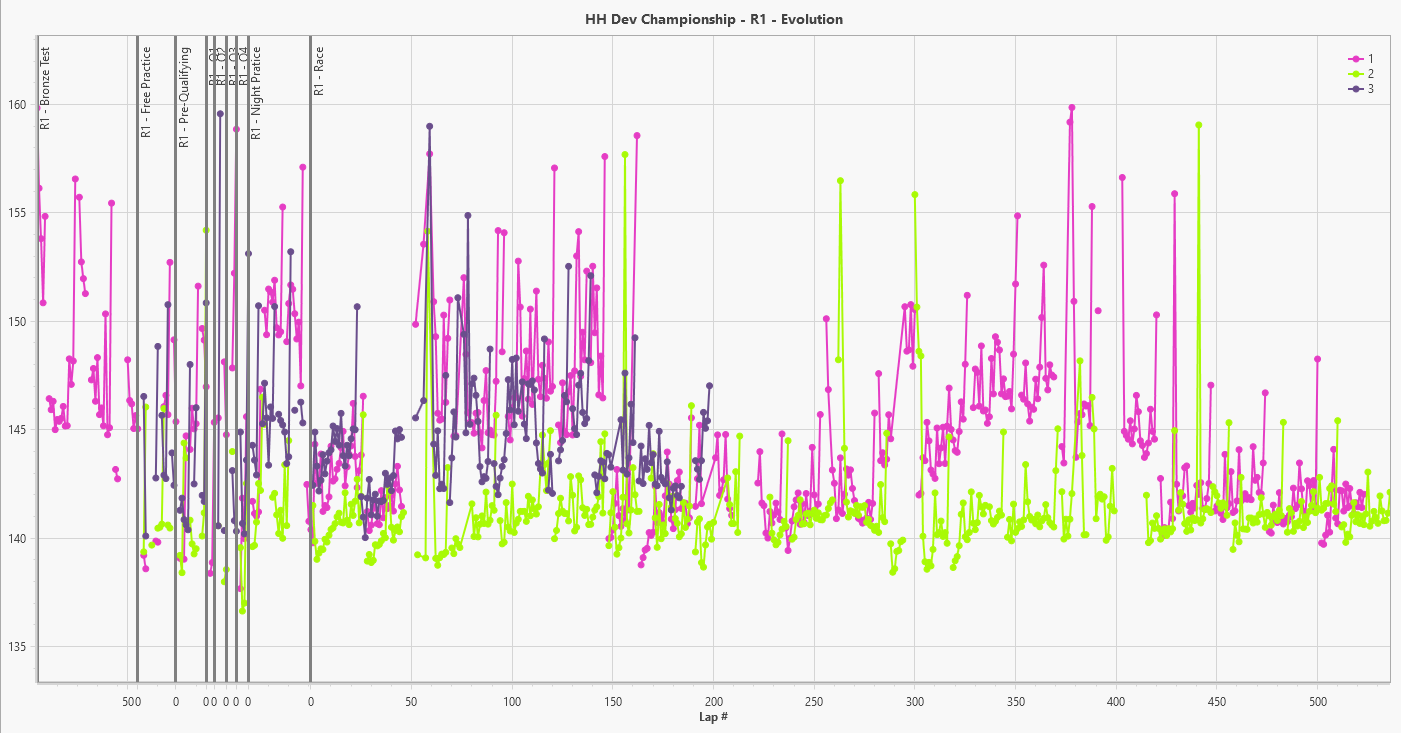
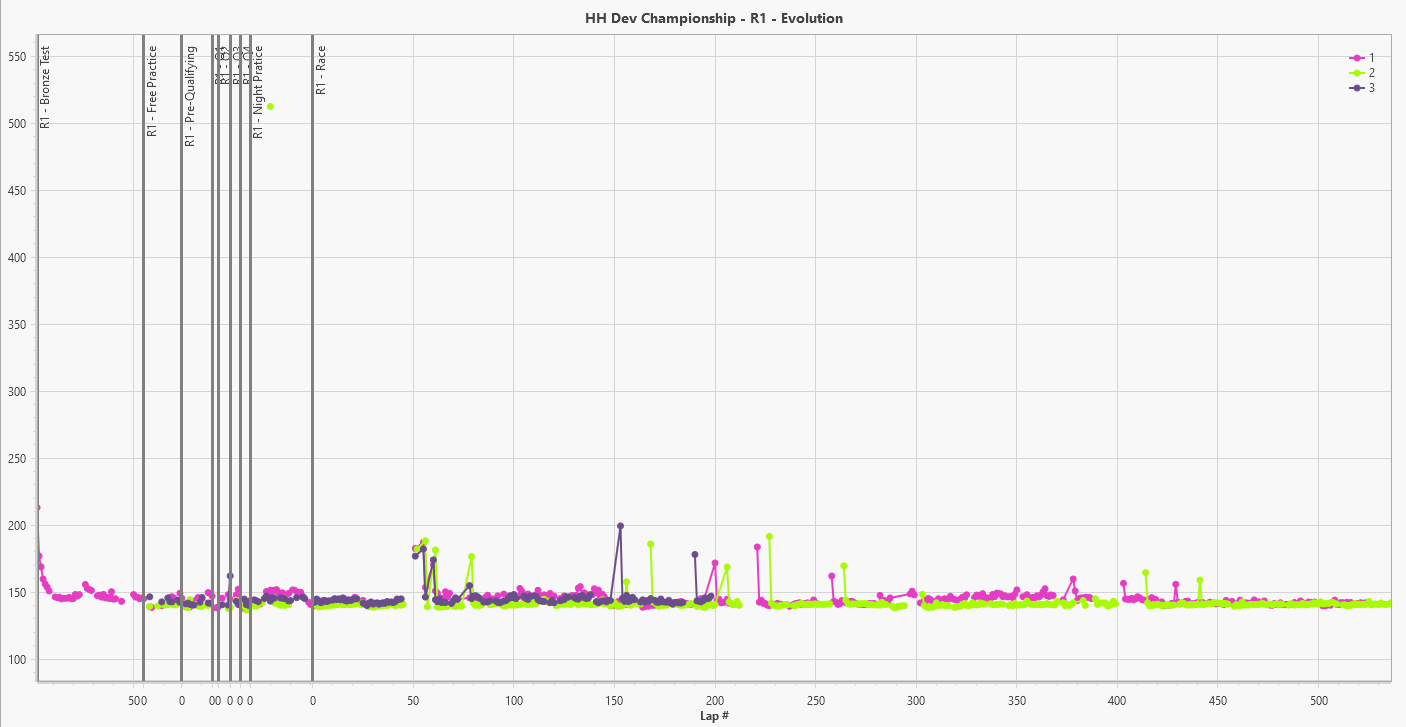
The graph will now be displayed properly. In this example, three cars are selected.
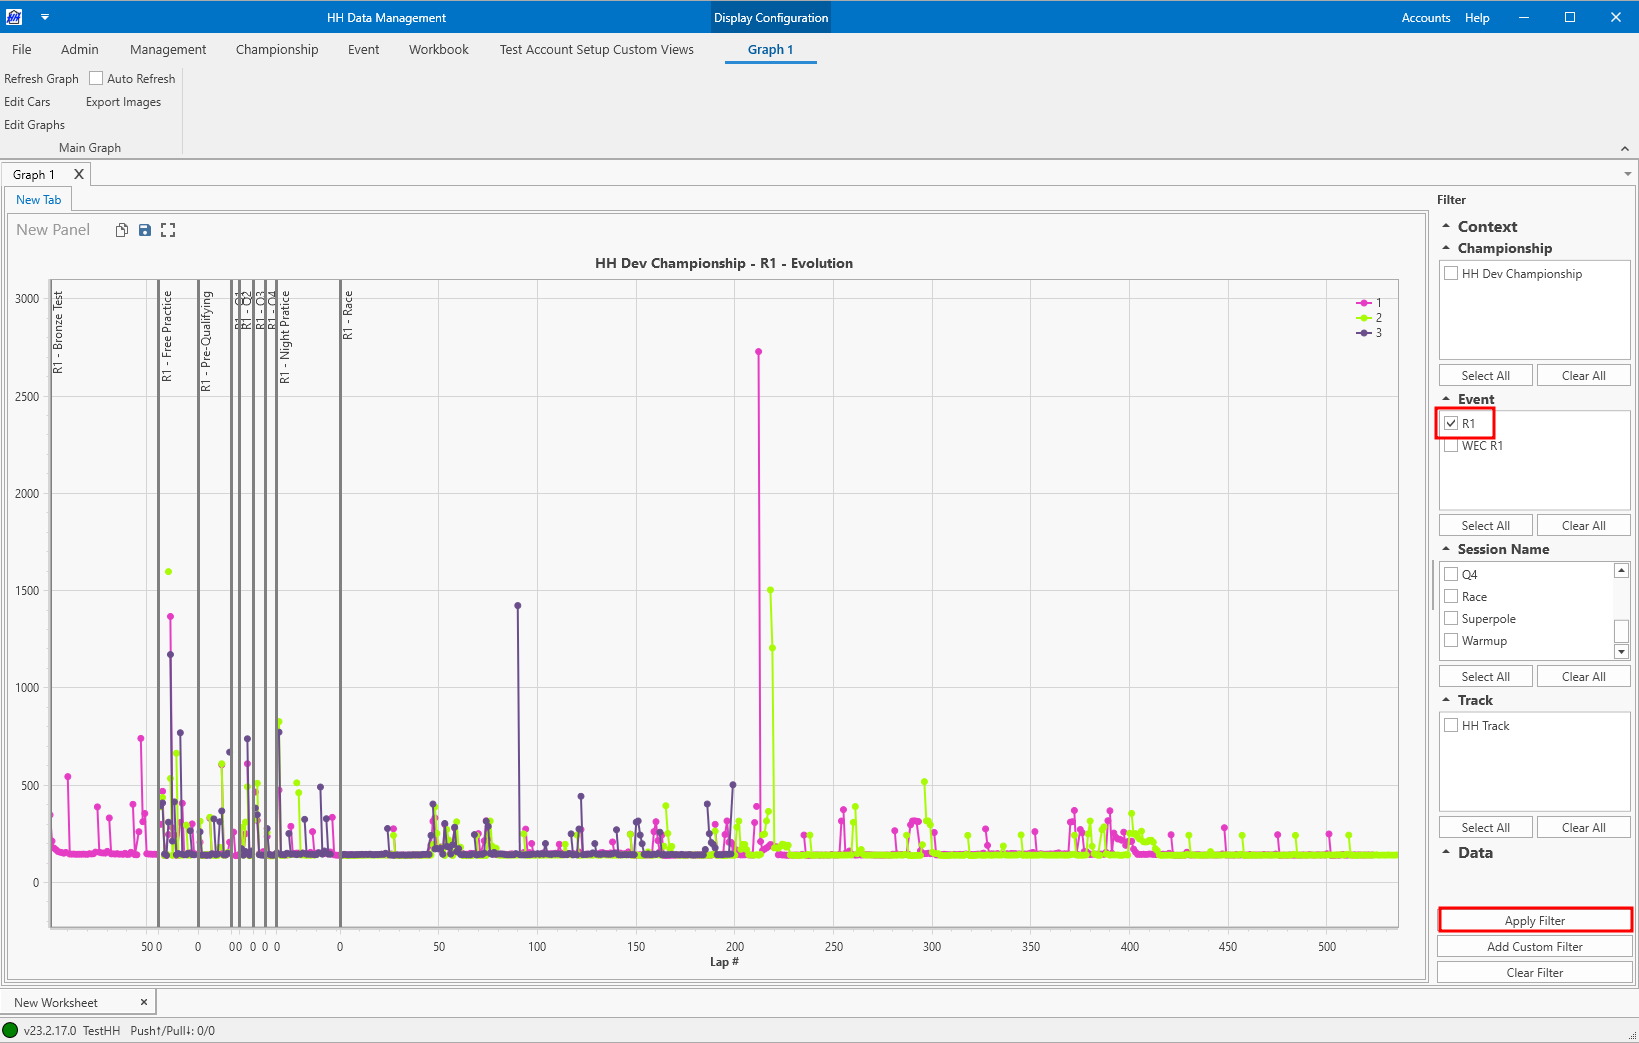
Selecting events
One subscribed event will also be automatically selected to display. The events that are shown on the graph can be edited by changing the selection in the global filter on the far right and clicking Apply Filter.
Filtering data
The graph can be filtered to only show representative laps. There are a number of ways this can be accomplished:
- using the data filter on the global filter
- using a parameter defined on the event
- using the filtering in the scope definition
Using the global filter
Click the add custom filter button on the global filter. A window will open, and an expression can be defined to hide all laps:
- select the filter type to be lap
- write an expression that hides all in and out laps and only shows laps where the track status is green

The resulting graph has most of the outliers removed:
Using filtering in the scope definition
A similar filter can be defined in the Laps entry in the panel scope library on the edit graphs window:
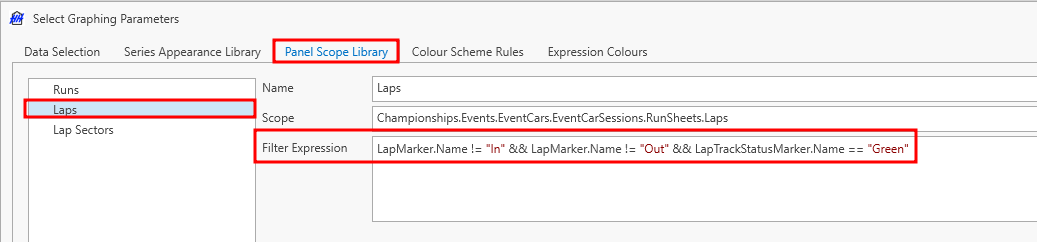
The result is the same as before:
Using a parameter defined on the event or session
To use this method you must have the correct permissions to access the definitions view
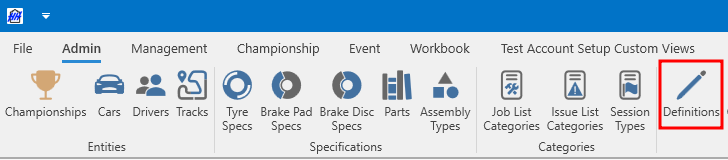
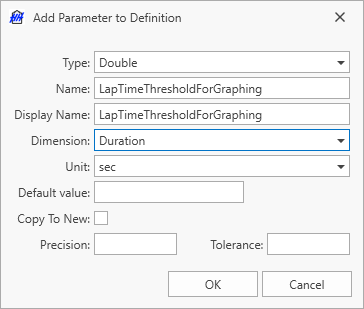
A different approach could be to use a lap time threshold defined on the event or session, and use this in the filter expression. Go to the definitions view:
Select the session definition, select the parameters tab and click the add button on the ribbon bar:
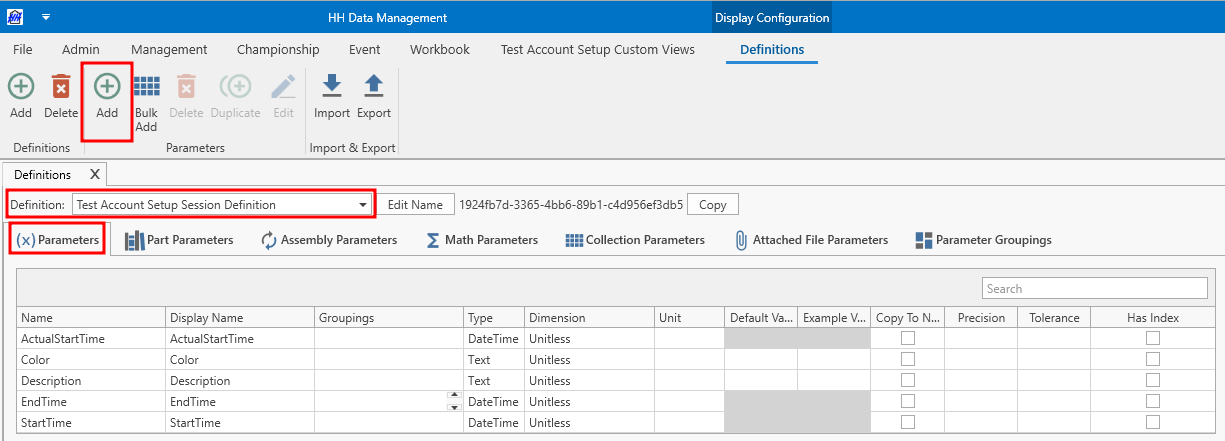
Create a double type parameter:
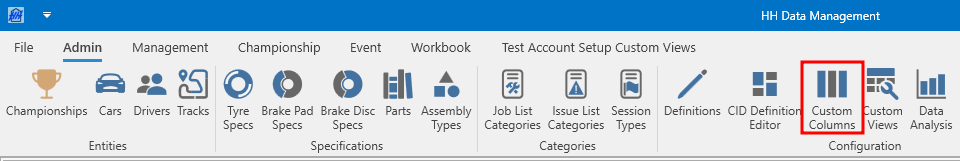
Now go to the custom column profile view:
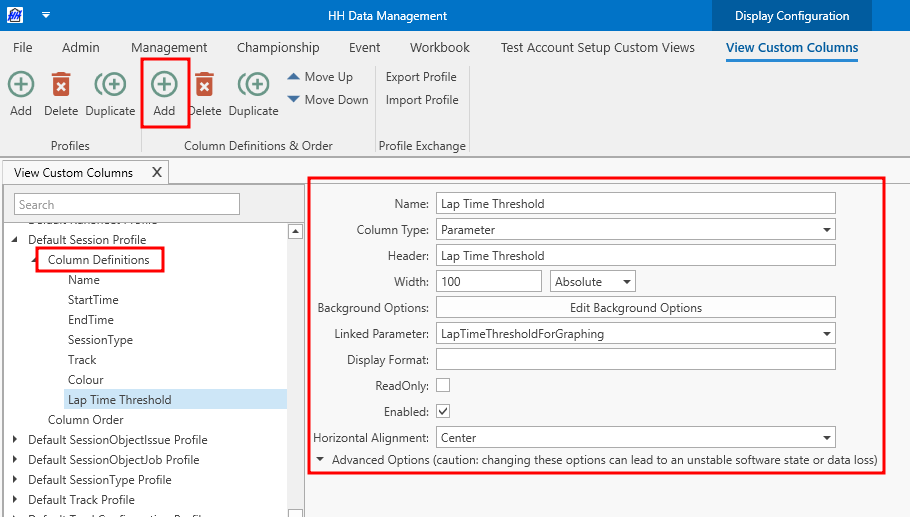
Select the column definitions node under the Default Session Profile, click the add button on the ribbon bar, and create a parameter type column to show the new parameter that was created:
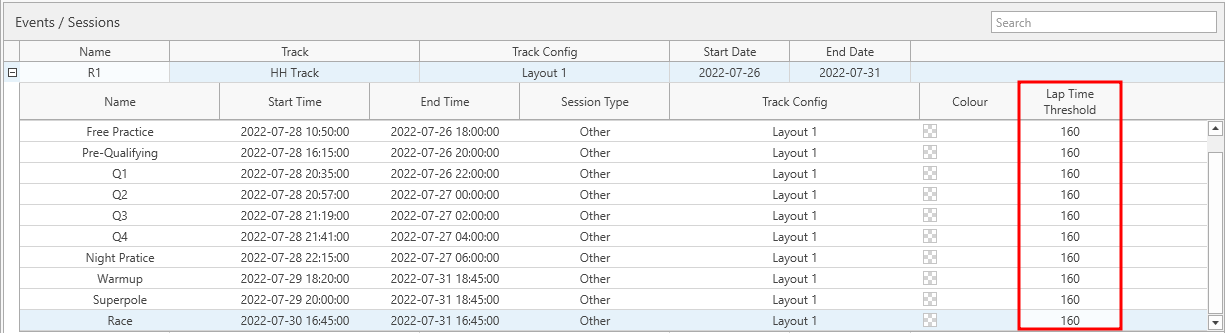
Now go to the event management view:

The new column will show and the maximum lap time threshold can be entered, for this example, all laps slower than 160 seconds will be hidden:
Now go back into the graph, and create a custom filter on the global filter:

Only laps with a lap time less than 160 seconds will be shown: