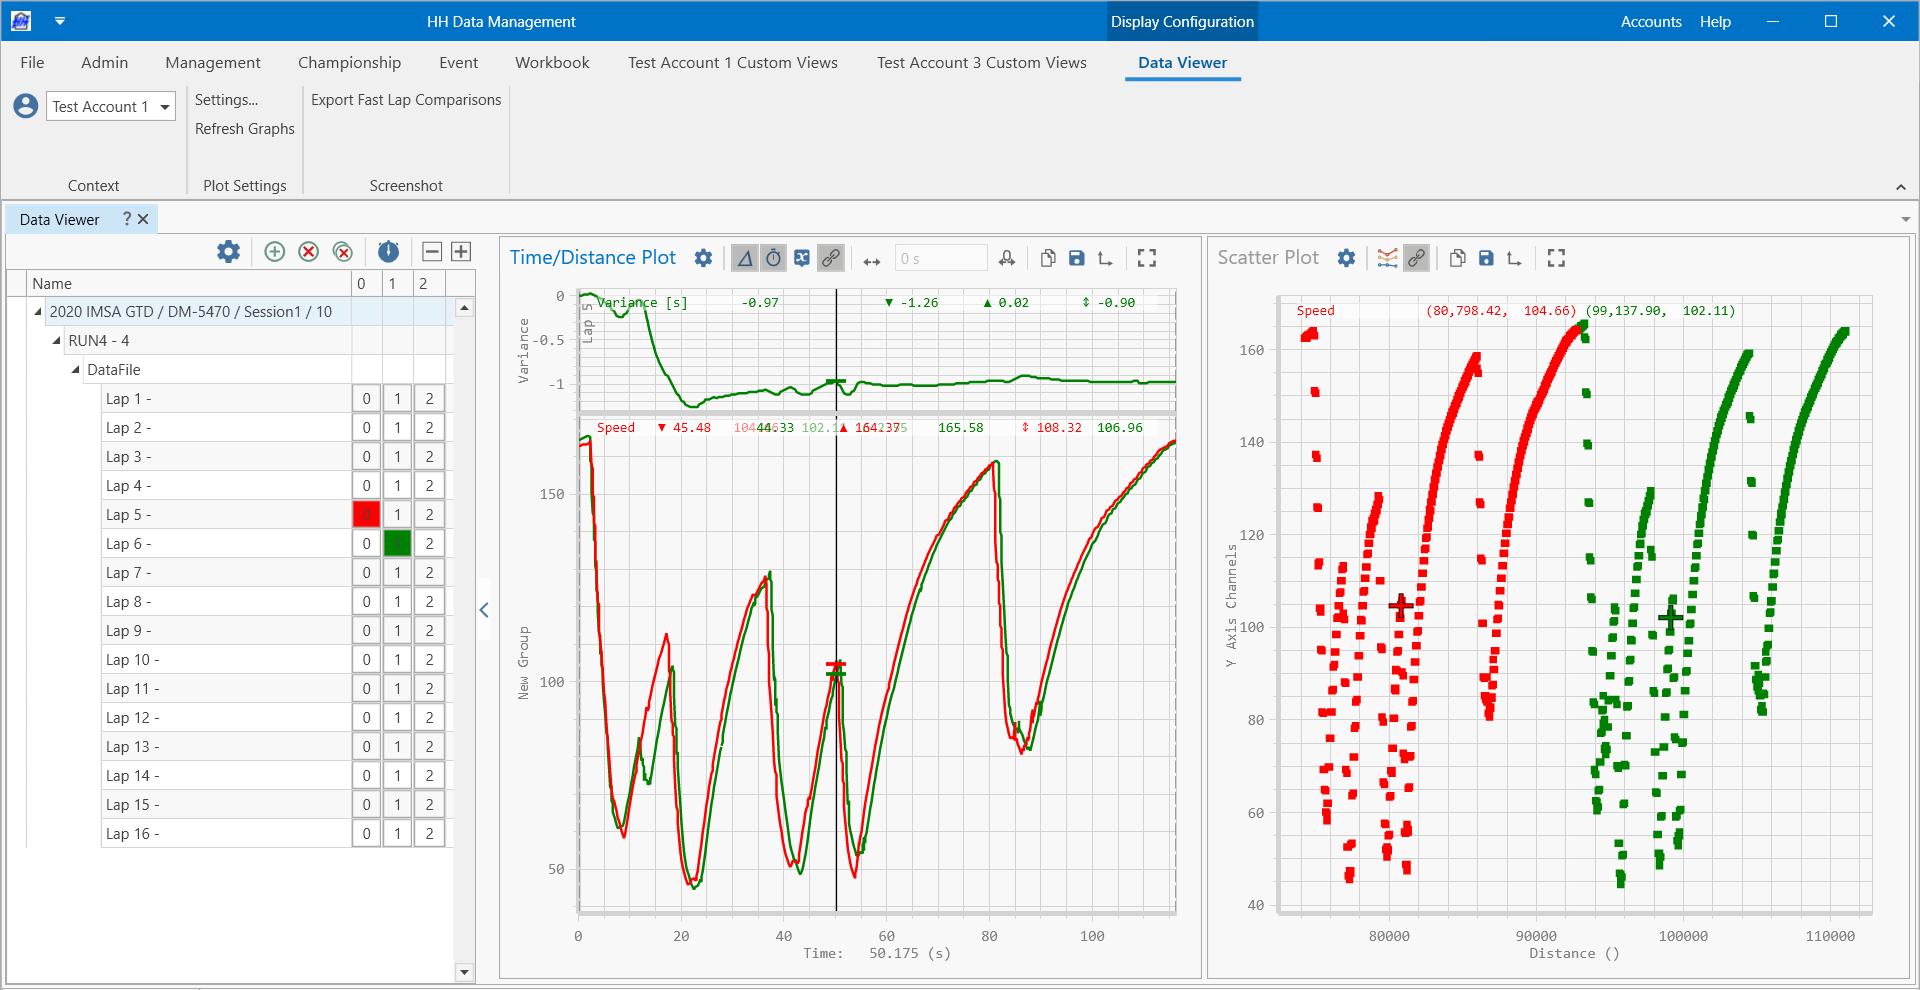
Data Viewer
Data Viewer is designed to be a visualization tool for attached data files. It provides the ability to view the vehicle data logs within the context of the session and run data stored in HH Data Management. Primary use cases include:
- Comparing vehicle or driver performance
- Viewing the output of data analysis math calculations
- Sharing data analysis between users
Data Viewer is accessed from the Event tab of the ribbon bar:

Data Viewer configuration and requirements
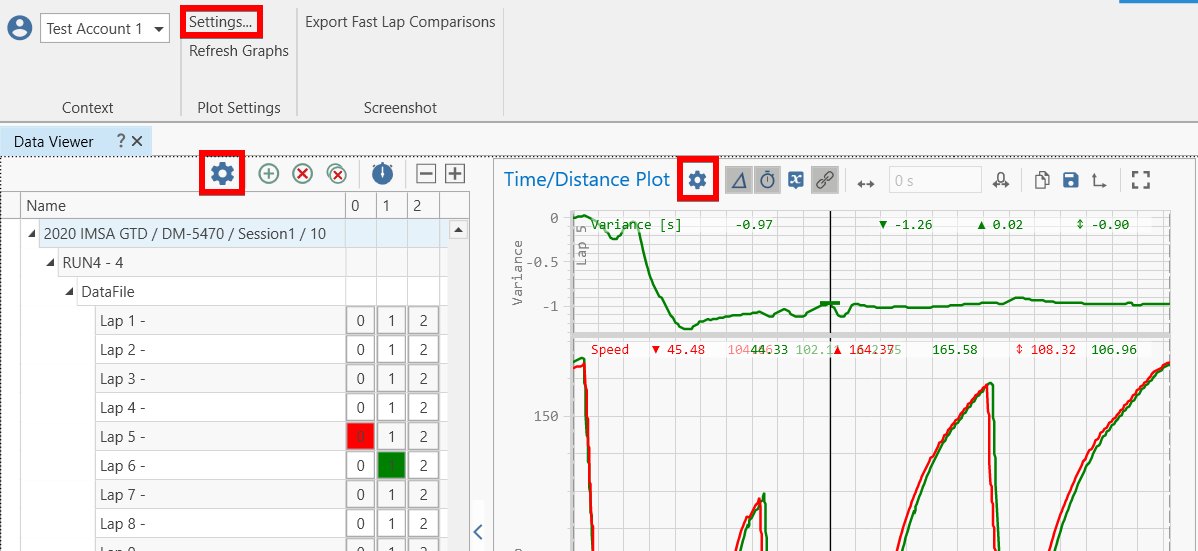
To configure the Data Viewer view, open the Settings window.
Plot Definitions
The Plot Definitions tab allows the user to add, edit, or remove the plots that appear on the Data Viewer screen.
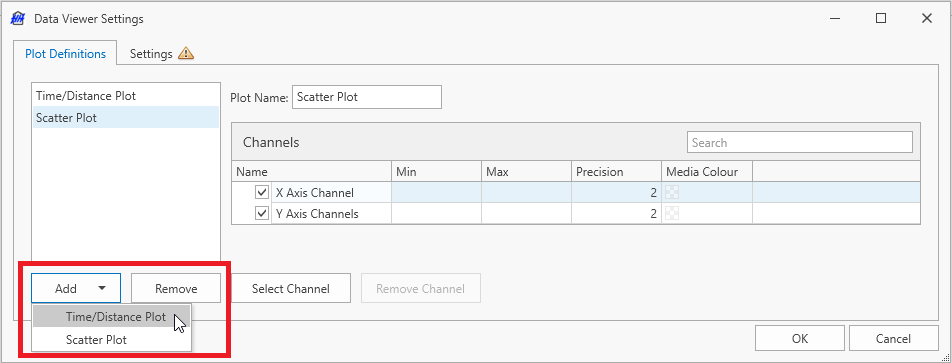
The Add drop-down menu at the bottom of the Plot Definitions tab shows the available plot types:
Data Viewer plots can be dragged and tiled by the user in a custom layout. Drag the plot title bar to move a plot in the layout.
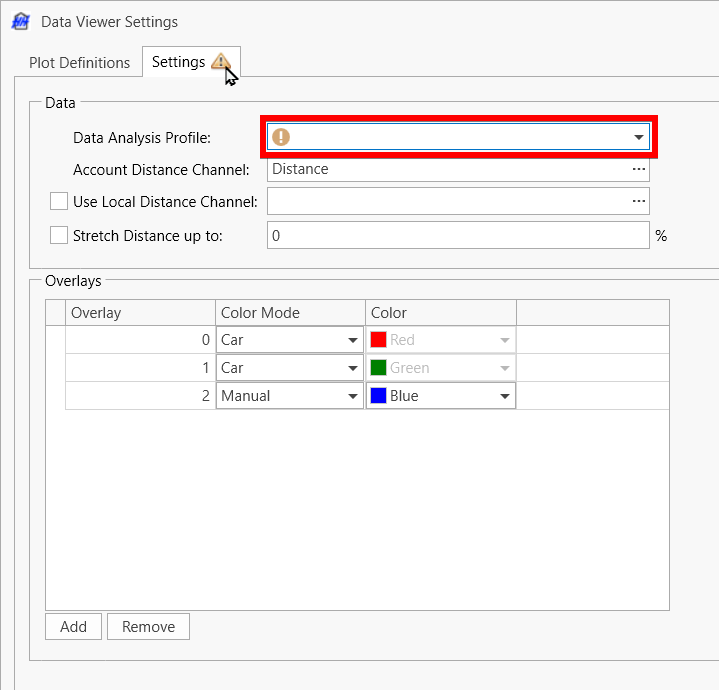
Data Viewer Settings
The Settings tab exposes the settings that control all plots in the Data Viewer.
| Data | --- |
|---|---|
| Data Analysis Profile | The data analysis profile referenced in the plots (required) |
| Account Distance Channel | The distance channel that is defined account-wide. It is saved in the text property named "DataViewer_DistanceChannelName" in the Account Options definition. Changing this value in one Data Viewer tab will affect all other Data Viewer tabs and other users. |
| Use Local Distance Channel | When checked, the Data Viewer tab will use the channel name defined in the text box, and only save this value to the layout |
| Stretch Distance up to | When checked, the distance channel will be stretched to match the lap length defined in the active track configuration. If the maximum value of the channel falls outside the percentage limit of the lap length, the distance channel will not be stretched. |
| Overlays | --- |
| Color Mode | Car - use the car color for all channels of the overlay |
| Plot Definition - use the channel colors from the plot definition for the channels, and car color for the overlay title | |
| Manual - use the Color option for all channels | |
| Gray - use a default gray color for all channels | |
| Color | In Manual Color Mode, this color will apply to all channels when plotting more than one overlay |
| Add | Add an additional overlay |
| Remove | Remove an overlay |
Distance Channel Requirements
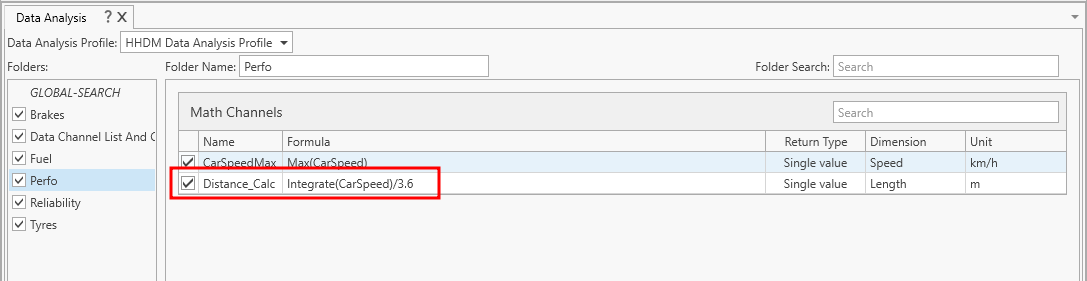
To plot data against distance, the Data Analysis Profile must define a distance channel (either as a Data Channel found in the data file, or a Math Channel calculated by HH Data Management.) In the absence of a Distance channel, Time/Distance plots will only support the Time mode for the X axis.
A Distance math channel defined in the Data Analysis Profile:
Data file selection
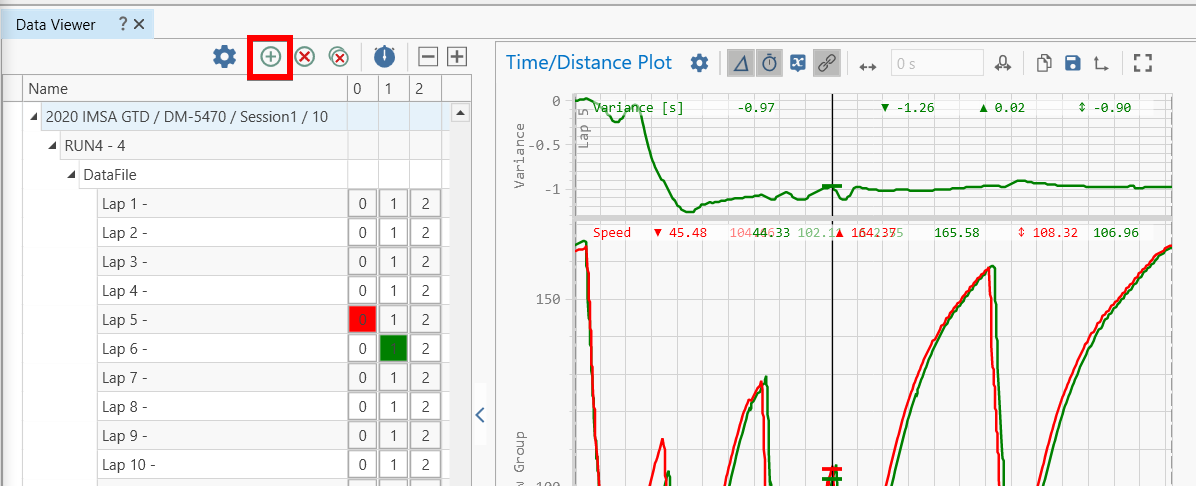
The File Tree panel on the left of side of the Data Viewer shows the opened files. This control allows the user to select which laps will be shown in the plots on the right side of the Data Viewer.
Click the Add button in the file tree panel on the left to open the file selection window:
Opening data files
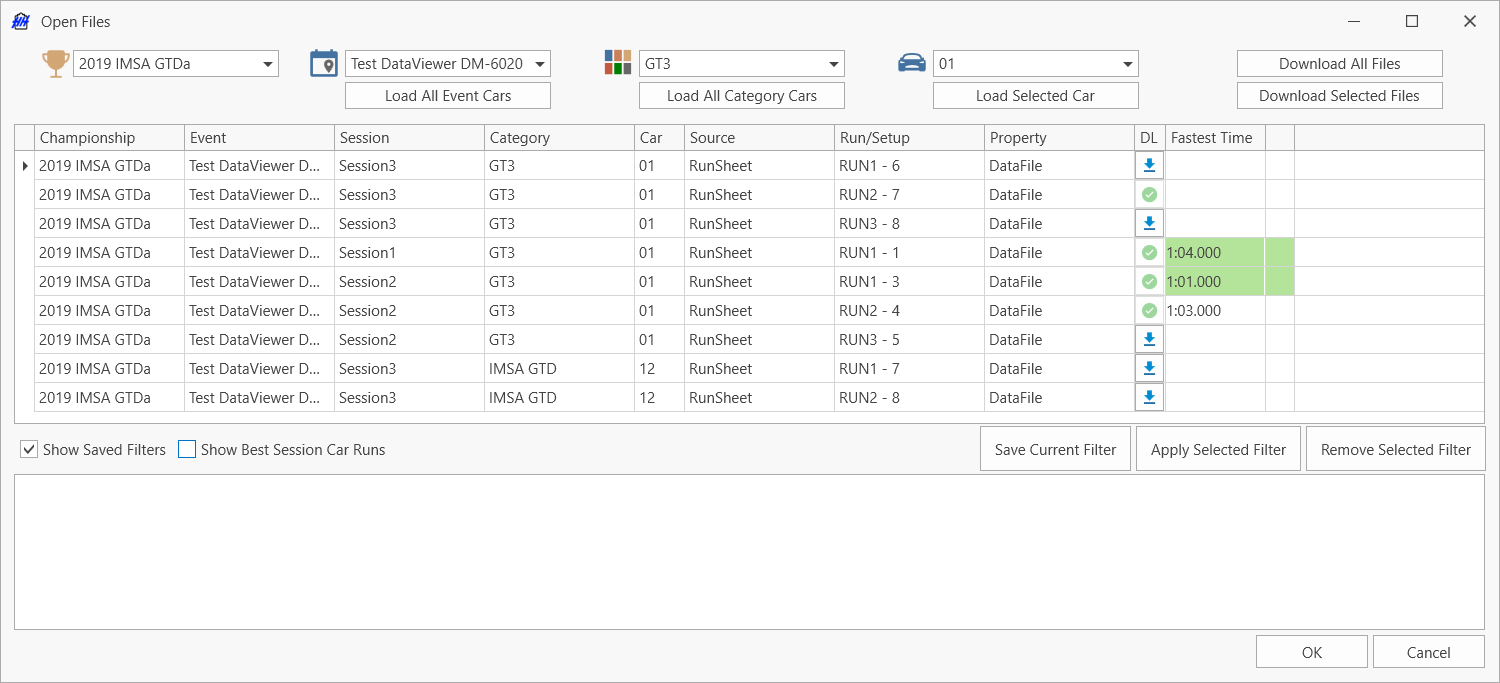
The Open Files window provides two functions:
- Trigger the loading of event, session, and car caches
- Select available data files to plot in the Data Viewer
The combo boxes at the top are used to control the cache loading. After selecting the desired values in the combo boxes the "Load" buttons are used to load all caches based on the selection:
- Load all categories - loads all cars from all categories within the selected event
- Load all cars - loads all cars from the selected category
- Load car - loads the selected car
Once the caches are loaded, any runs, sessions, or setups with attached files of supported file format types will be shown in the table.
Filtering data files
This table can be filtered and sorted by session, category, car, attached file parameter name, etc. Use the column headers to filter and sort the data files.
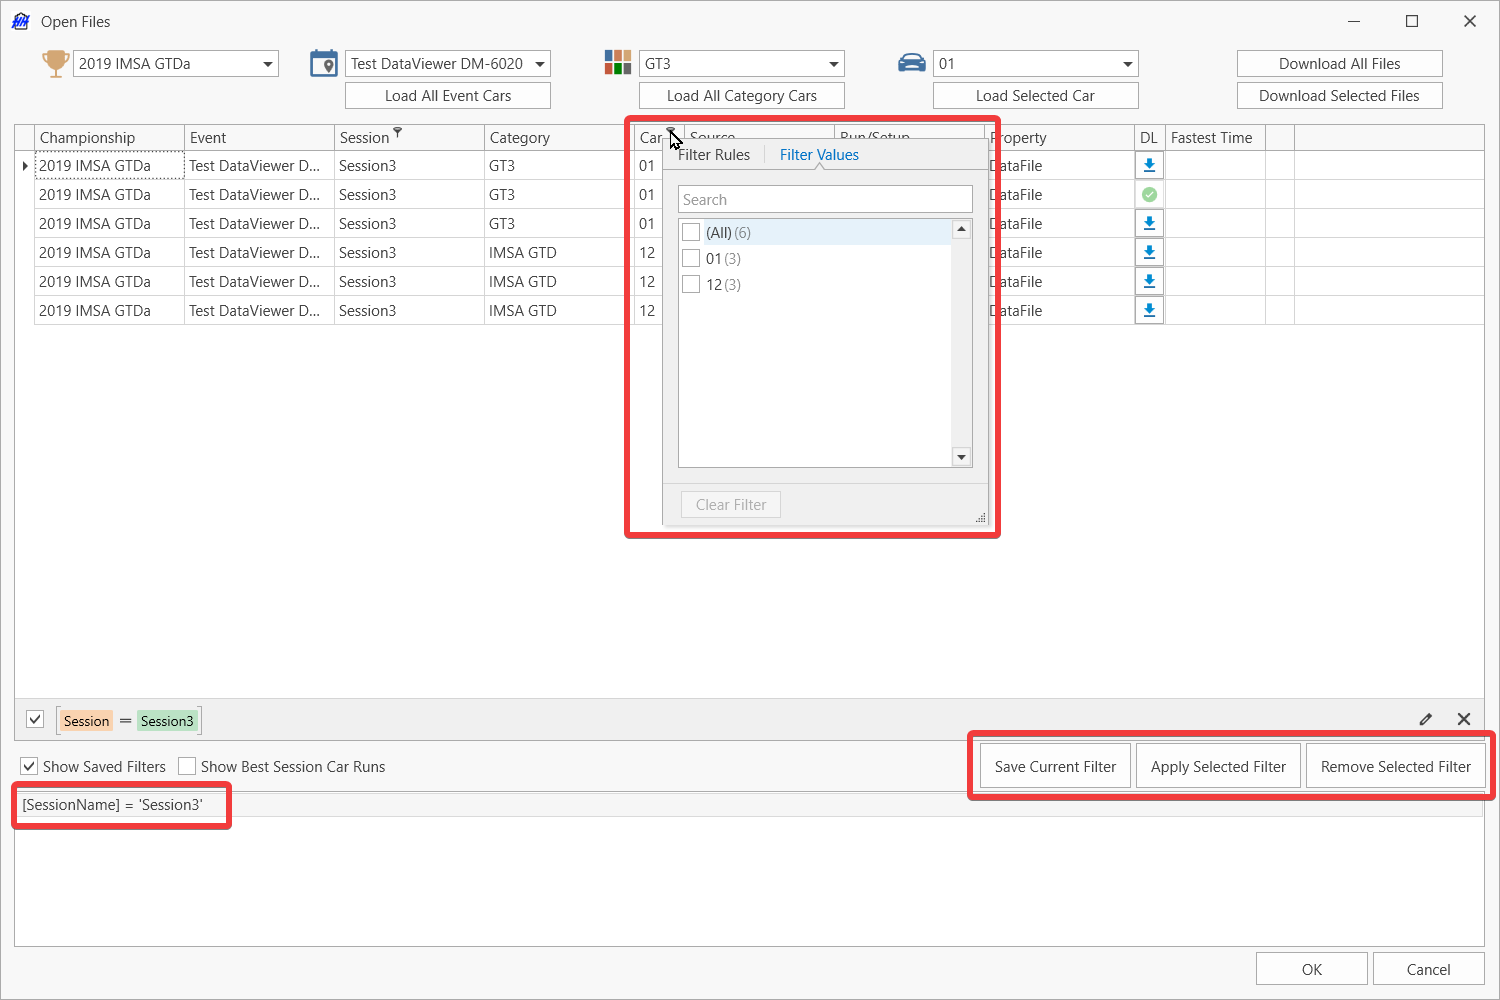
Often-used filters can be saved to local settings using the filter management buttons.
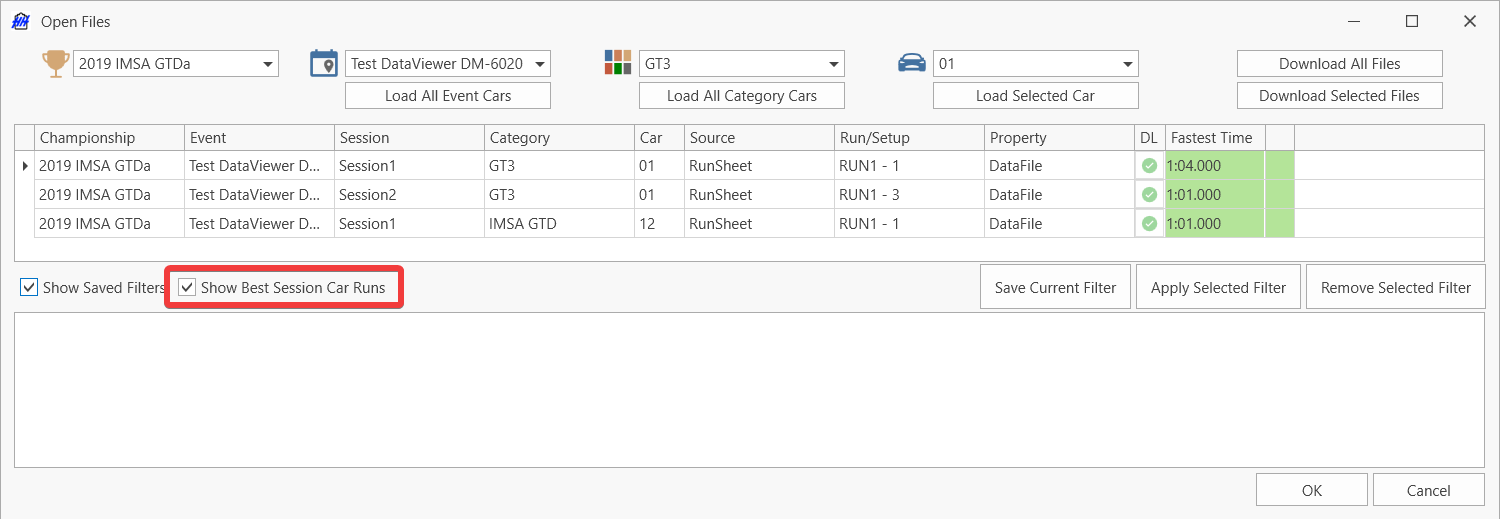
There are two features that help to locate the run with the fastest lap of a session overall, and the fastest lap of a session per car.
- The show best runs checkbox will filter the list to show only the runs that have the fastest overall lap of the session:
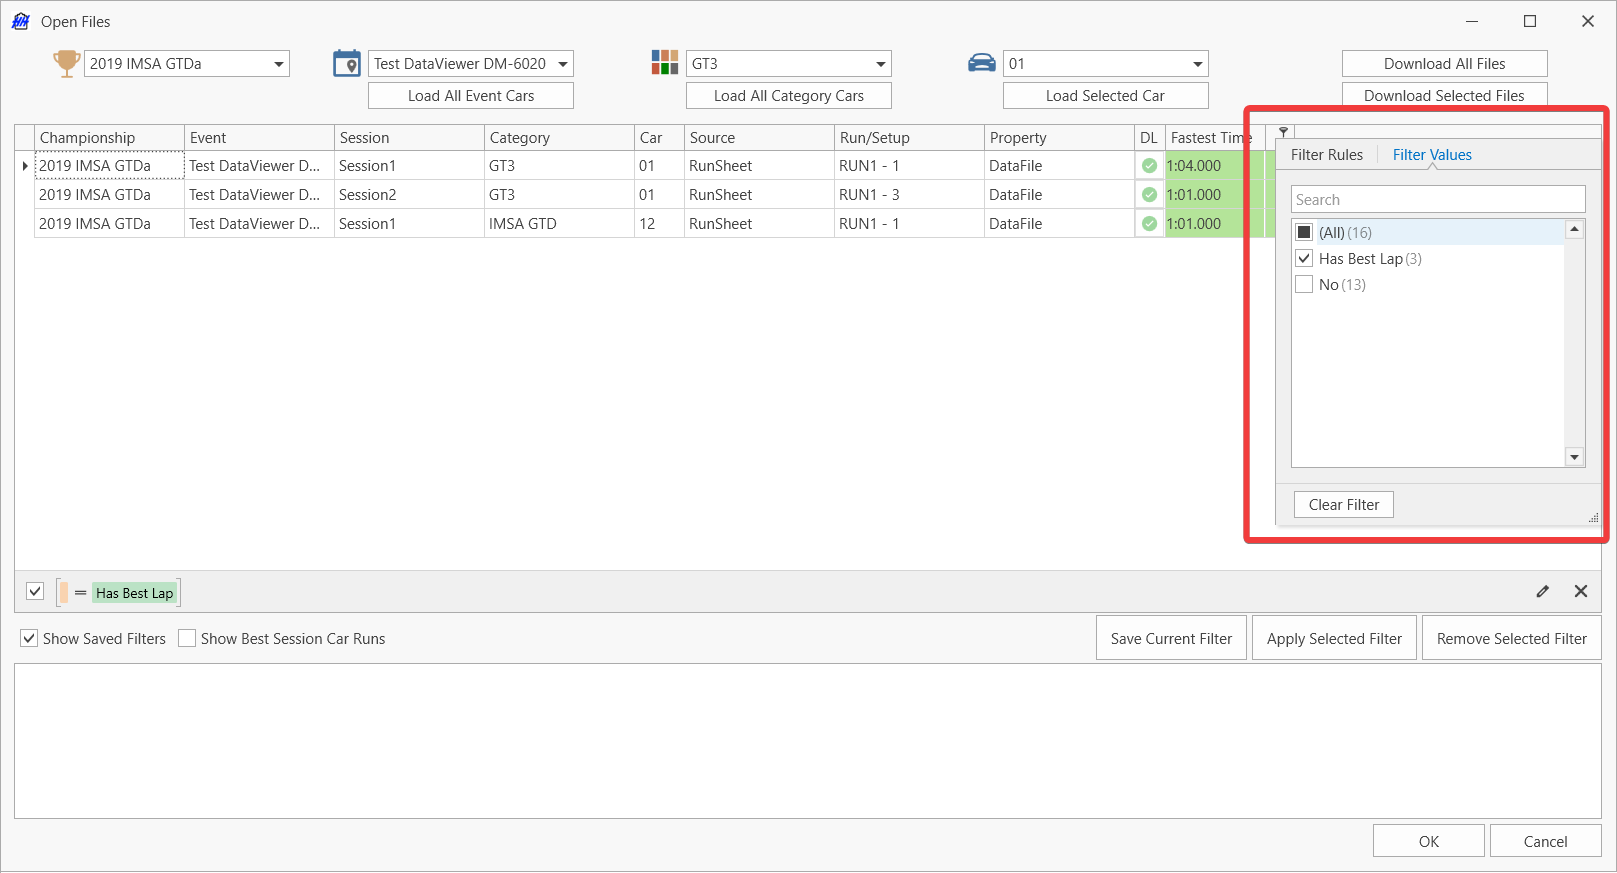
- To show the run with the fastest lap for each car, the final column can be used to filter on the value "Has Best Lap":
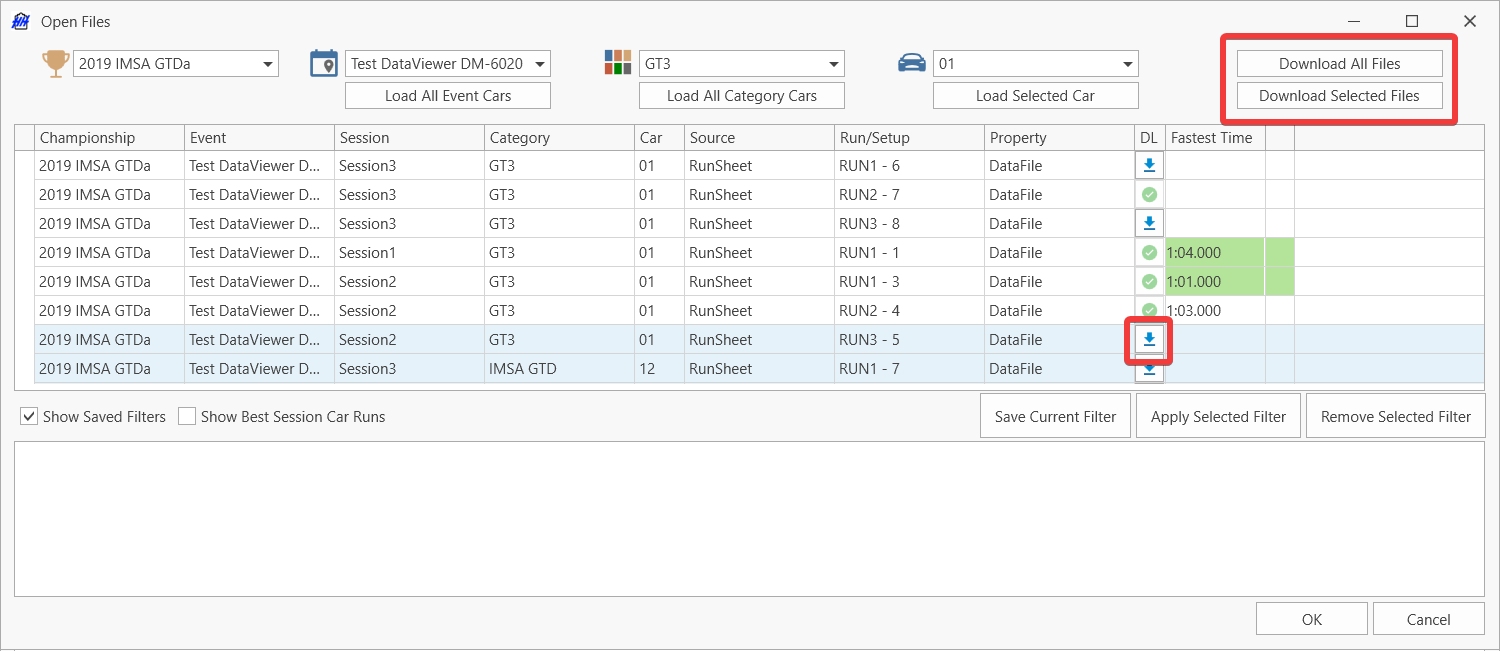
Downloading data files
Before data files can be displayed in a Data Viewer graph, they must be locally available. The file selection window provides a column with the file status, and three ways to download files without leaving the Data Viewer:
- Click the Download button in the Status column
- Select the desired rows and click the Download Selected Files button
- Click Download All Files to download all files currently displayed in the grid.
Data files with the "Available" status can be opened in the Data Viewer by the user selecting the rows and clicking OK
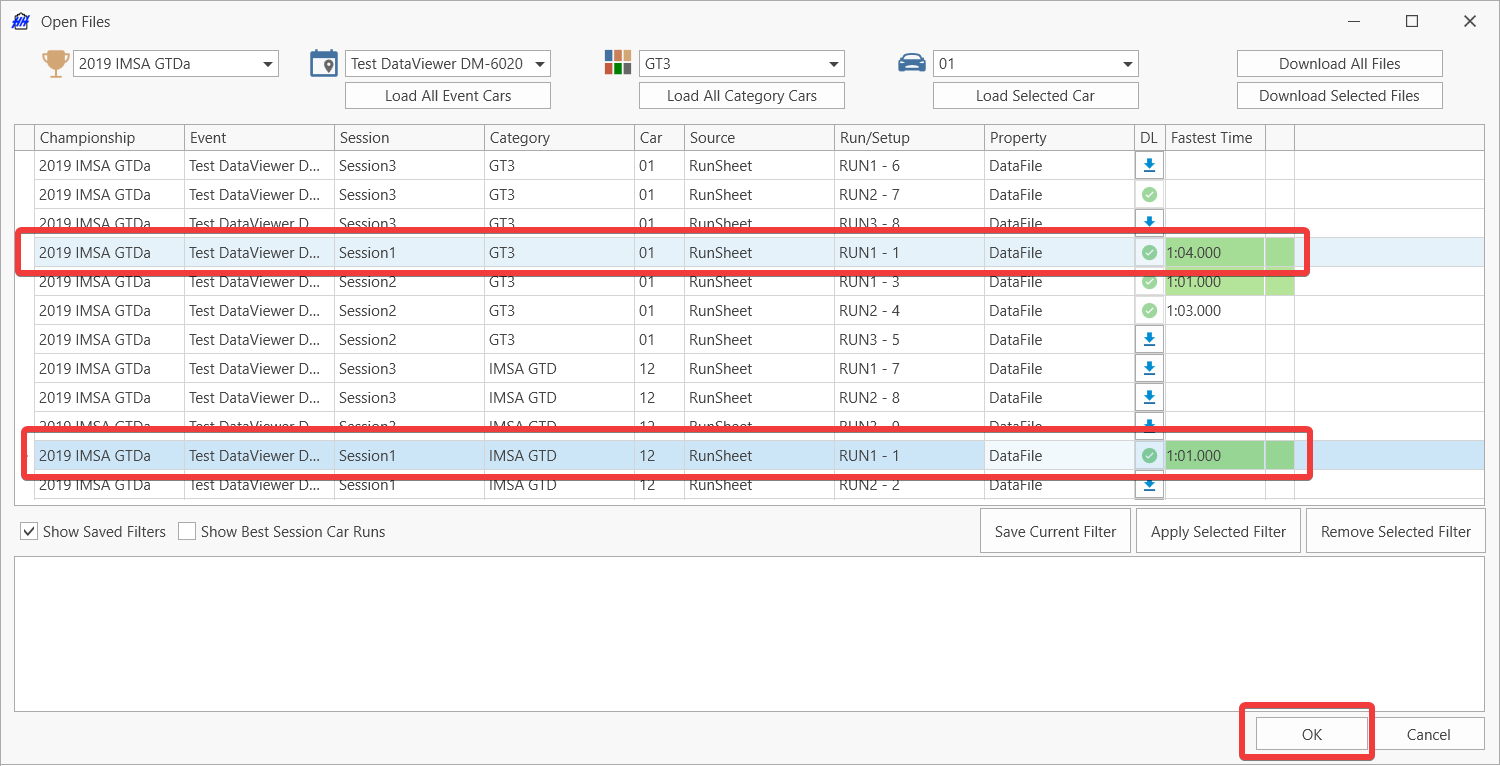
Lap times
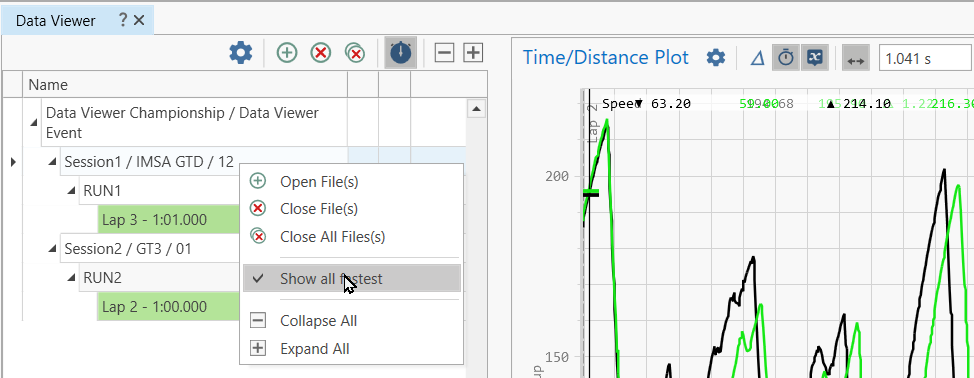
The fastest lap time will be highlighted green.
For run attached files, the lap times are loaded from the run sheet laps. When hovering over a lap time, a tool-tip will show the lap time from the run sheet and from the data file.
For session and setup attached files, the lap times are loaded from the data files.
When viewing multiple files, the tree may grow long. Use the "Show All Fastest" button at the top of the file tree to hide all but the fastest lap in each run.
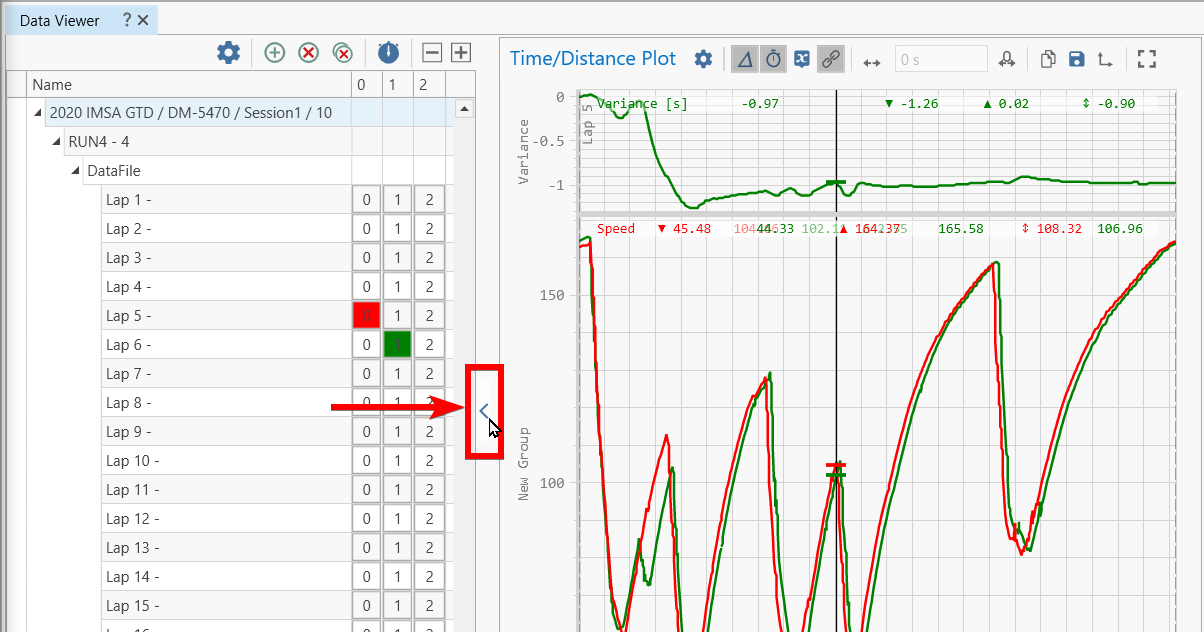
Hiding the file tree
The file tree can be quickly collapsed or expanded by clicking on the arrow button in the middle of the separator:
Time/Distance Plots
Definition
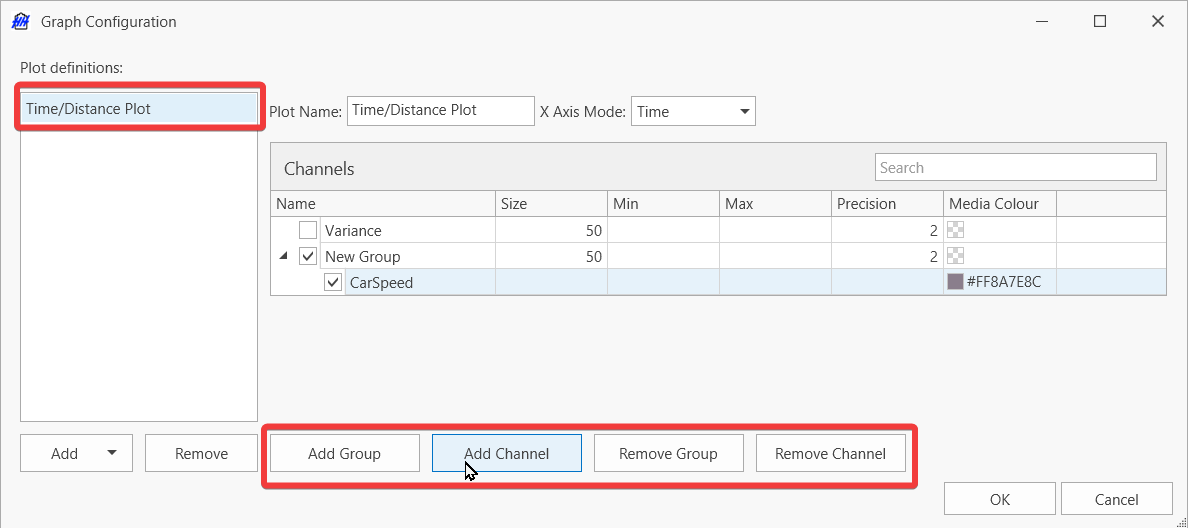
The user can add and remove channel groups and channels with the four buttons at the bottom of the window.
The Min and Max setting for channel groups will control the display limits of the related axes.
For automatic scaling, use Ctrl + Del to clear any previously set value.
For manual scaling, enter numeric values in the cells.
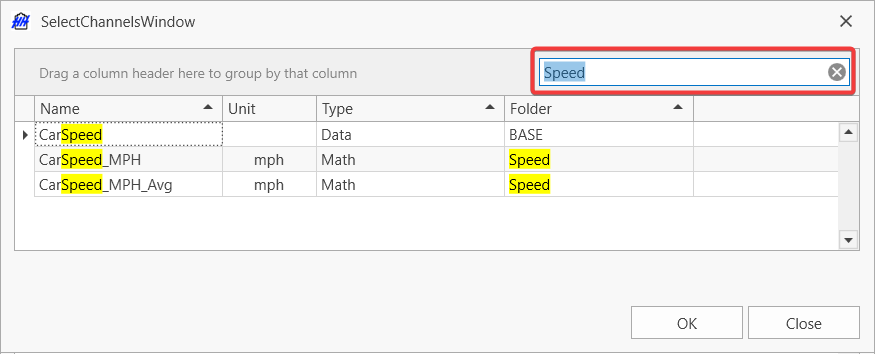
The "Add Channel" button opens a window with a list of all channels defined in the Data Analysis profile. The window has a search box to make channel selection easier in large data sets.
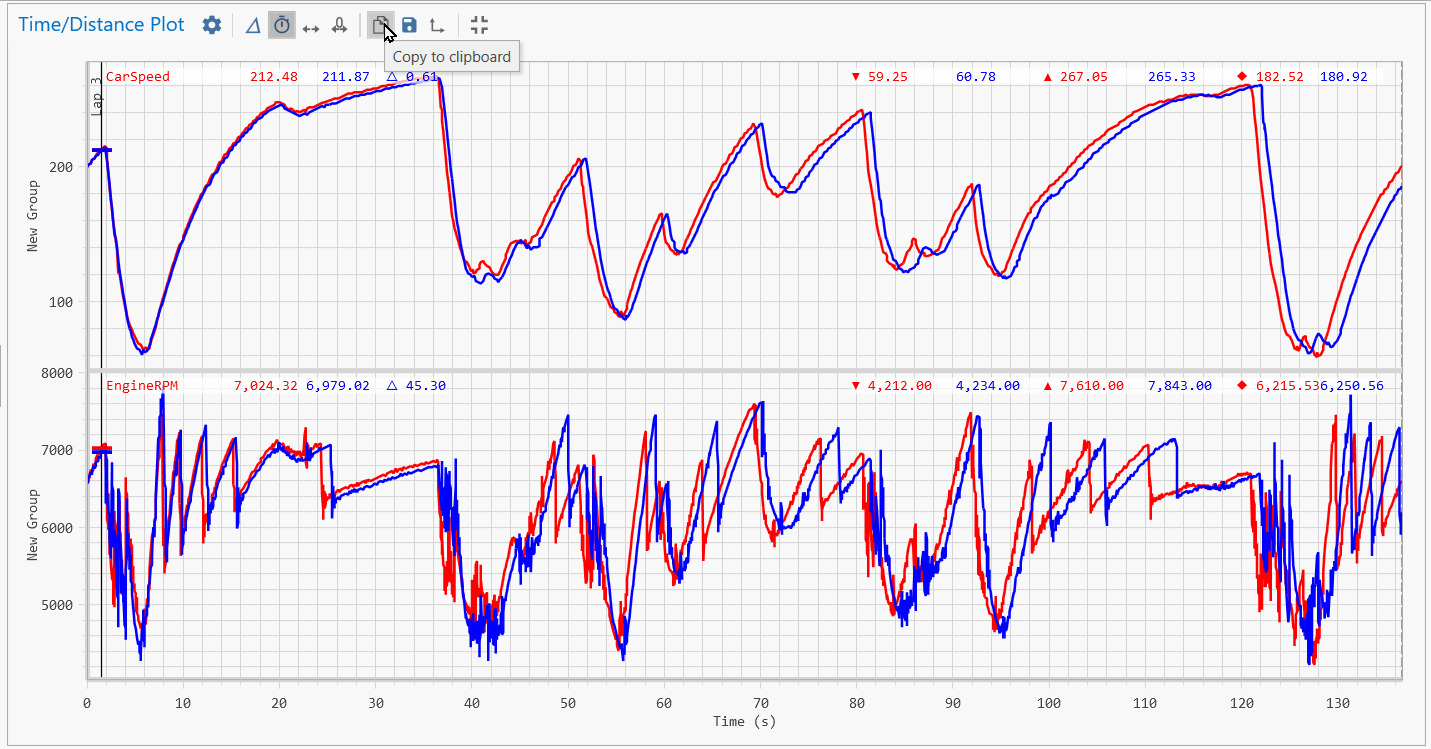
Plot View
A Time/Distance Plot may look like this:
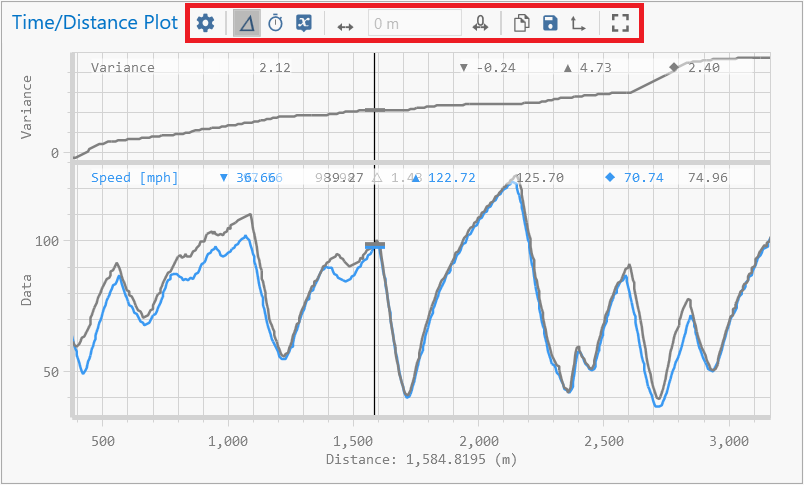
The top toolbar of each plot panel has quick-access settings for each plot:
| Button | Description |
|---|---|
| Settings button opens the Plot Definition tab of the settings window | |
| Variance (Time Delta) toggle button | |
| Time/Distance mode toggle button | |
| Enable popup point value tracker Note: the X value references the start of the data file | |
| Link this plot to Zoom/Cursor events | |
| Show/Hide offset axis | |
| Zero offset button | |
| Copy screenshot to Clipboard | |
| Save screenshot to disk | |
| Set screenshot size | |
| Maximize/restore plot panel |
Variance
The Variance toggle will add a subplot at the top of the panel and show the time delta between the overlays. The Variance is best displayed when the X Axis is set to Distance mode:
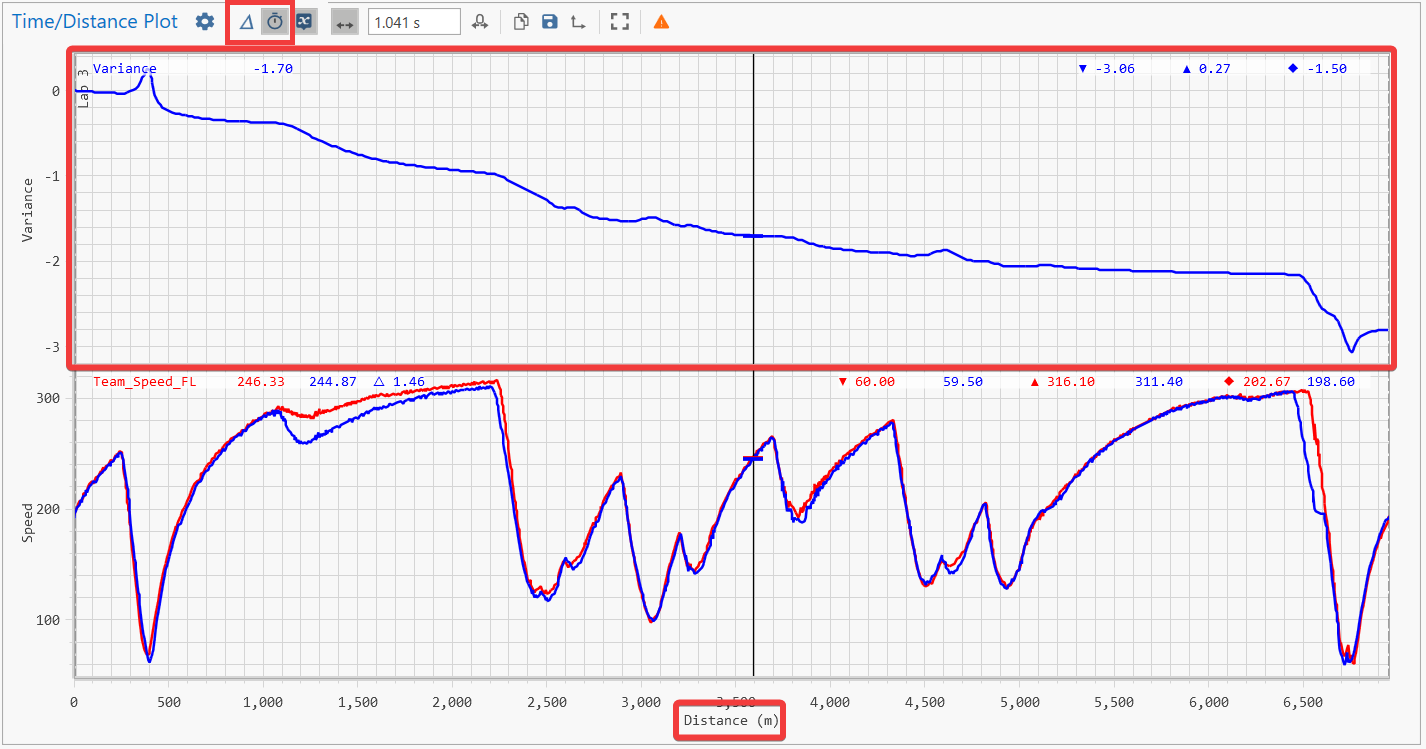
Calculating and displaying the Variance requires a valid Distance channel in both overlays.
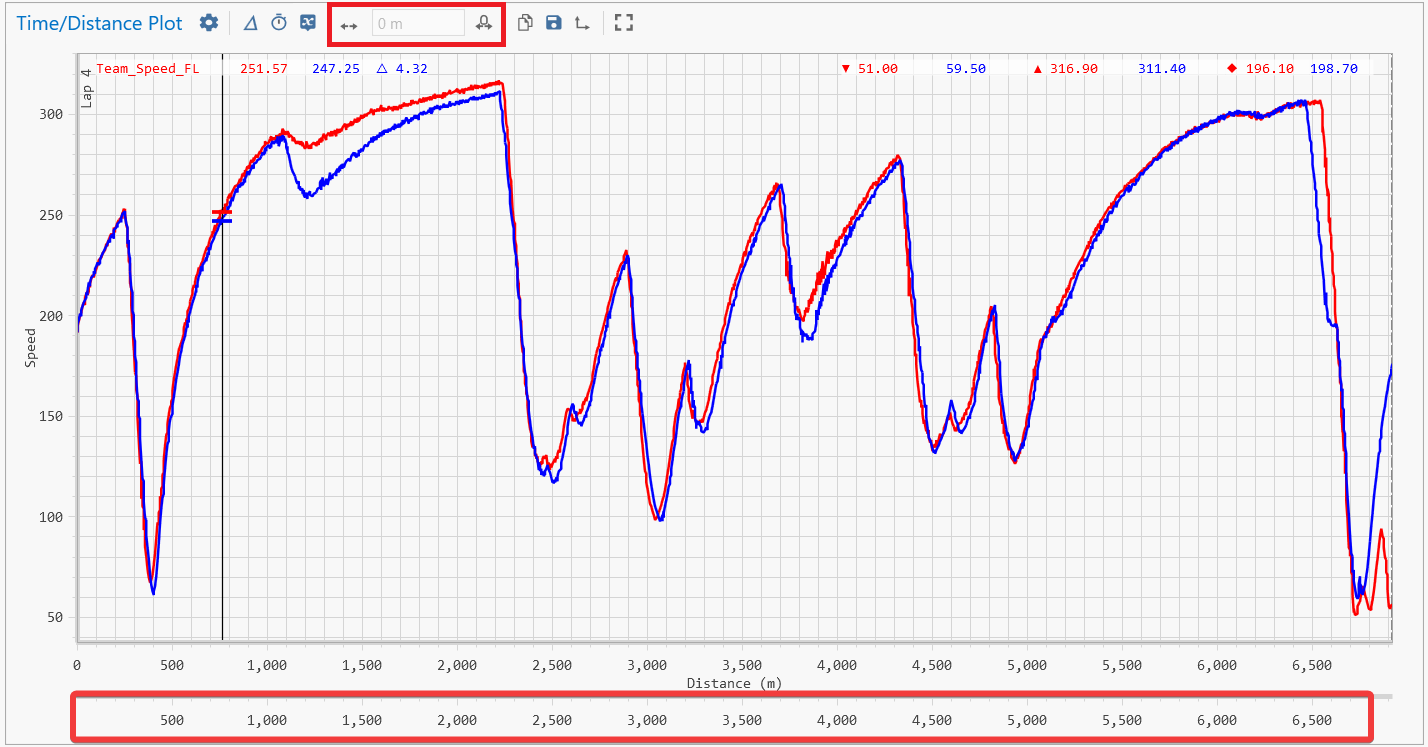
Offset Axis
The offset can be adjusted by dragging the secondary X axis when the "Offset Overlay" toggle is enabled. Disabling the offset axis will not clear the offset. The "Clear Overlay Offset" button will reset the offset to zero.
Plot Controls and Input Interactions
Mouse
| Action | Effect |
|---|---|
| Click + Drag | move cursor |
| Mouse Wheel | coarse zoom in/out |
| Ctrl + Mouse Wheel | fine zoom in/out |
| Ctrl + Click + Drag | pan X axes |
| Shift + Click + Drag | select zoom window |
| Double Click | reset zoom to selected lap |
| Click + Drag on Offset X axis | move the overlay axis by dragging the X axis below the main plot area |
Keyboard
| Action | Effect |
|---|---|
| Left Arrow / Right Arrow | move cursor |
| Up Arrow / Down Arrow | coarse zoom in/out |
| Ctrl + Up Arrow / Down Arrow | fine zoom in/out step |
| Shift + Left / Right | pan X axes |
| P / N | previous/next lap on primary overlay |
| W | zoom to the lap selected in the file tree |
| F2 | zoom out to full extent of the primary overlay |
| O | toggle the Offset axis |
Scatter Plots
Definition
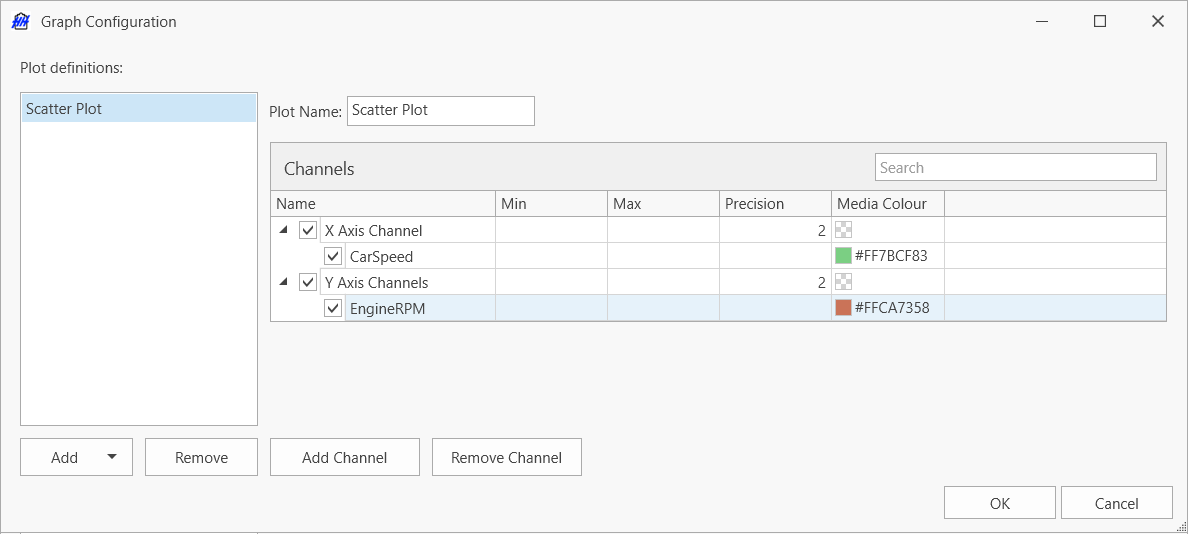
- The X Axis Channel group can contain only a single channel.
- The Y Axis Channels group can contain more than one channel.
Plot View
An example of a Scatter Plot:
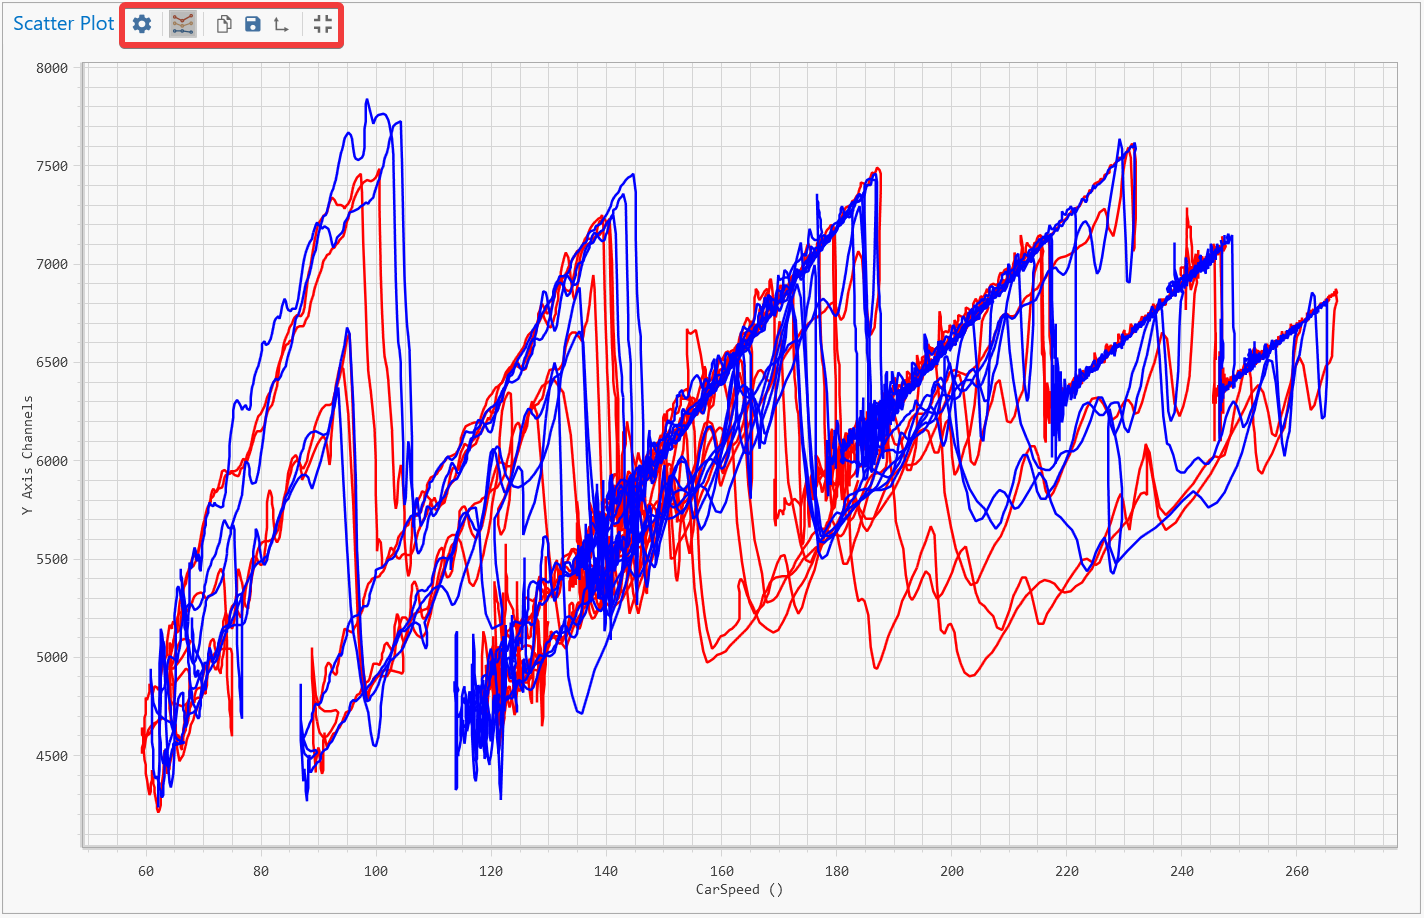
The top toolbar of the plot panel has quick-access settings for the scatter plot:
| Button | Description |
|---|---|
| Settings button opens the Plot Definition tab of the settings window | |
| Line/Point mode toggle button | |
| Link this plot to Zoom/Cursor events | |
| Copy screenshot to Clipboard | |
| Save screenshot to disk | |
| Set screenshot size | |
| Maximize/restore plot panel |
Plot Controls and Input Interactions
Mouse
| Action | Effect |
|---|---|
| Click + Drag | move cursor |
| Mouse Wheel | coarse zoom in/out |
| Shift + Click + Drag | select zoom window |
| Double Click | reset zoom |
Keyboard
| Action | Effect |
|---|---|
| P / N | previous/next lap on primary overlay |
| W | zoom to the lap selected in the file tree |
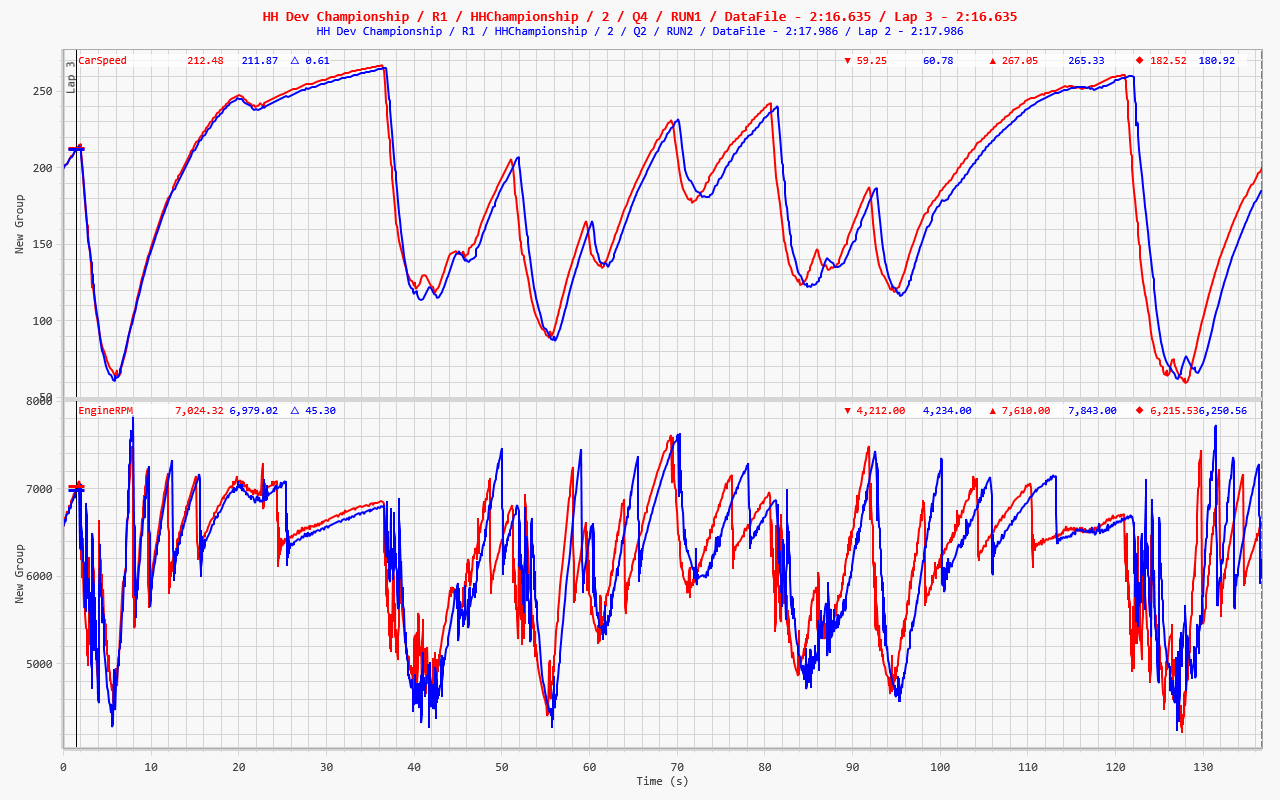
Screenshots
Data Viewer has the option to export a screenshot to a file or copy it to clipboard.
The resulting image will show the selected file context in the title above the graph.
Data Analysis Warnings
When a channel cannot be calculated, the top toolbar of the plot view will show a "Warning" button. Clicking the button, will switch the plot view to show the list of warnings.
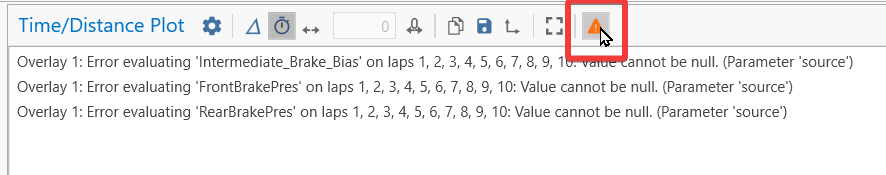
To see changes after editing the channels in the Data Analysis Profile, all plots must be refreshed with the "Refresh Graphs" button.