Event report
Event reports can be used to look at event data in a pivot grid format. First, a profile must be created that defines how the event data will be used to populate the pivot grid. Once a profile is created the event report viewer can be used to look at the data from selected events.
Event report profile
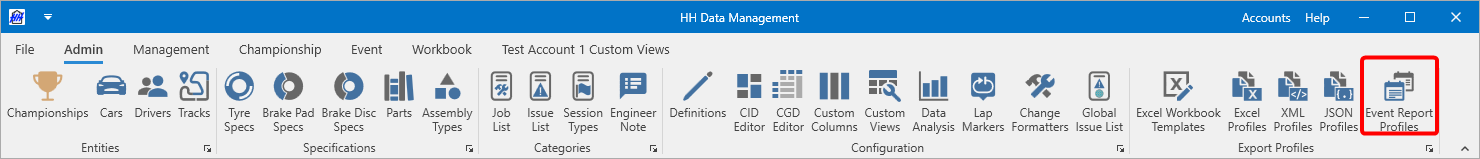
The event report profile view can be accessed from the admin tab of the ribbon bar:
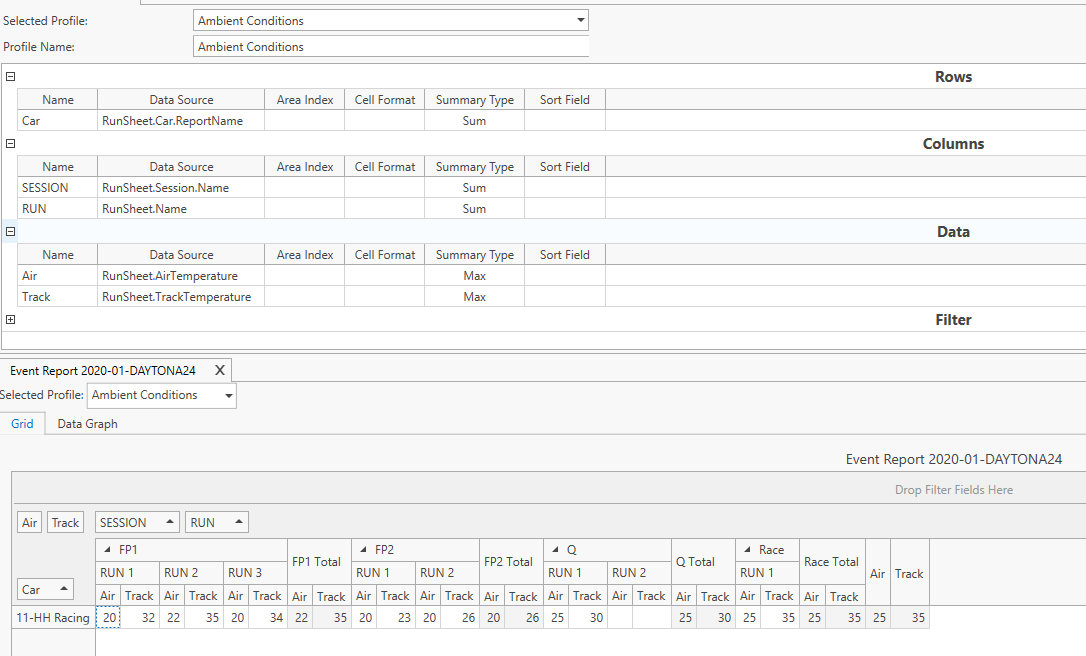
To create an event report profile definition fields for the following categories must be defined:
- Rows: Defines the categories for rows data
- Columns: Defines the categories for columns data
- Data: Defines the information to be displayed on the table
- Filter: Defines categories to filter the information
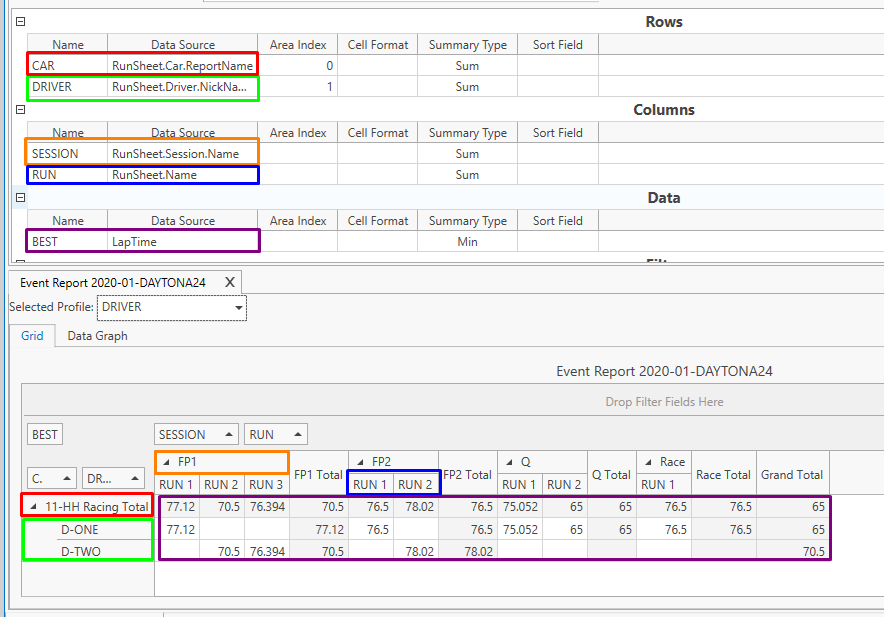
The fields have the following properties:
- Name: Display name for the field
- Data Source: Expression for the field parameter. The information is analyzed on a lap level, one data point is generated per lap. The syntax allows math expressions. As the scope is the lap level, to access the runsheet level properties, like car or driver, start the expression with "RunSheet". This will force a scope change.
The information is analyzed on a lap level, one data point is generated per lap
-
Area Index: This property is only used for Rows and Columns and indicates the item priority in case multiple fields are defined for the same category.
-
Summary Type: This property indicates the kind of display summary for each field. For example, if the field is "LapTime" and the summary type is "Min" the grid will display the best lap time for each data group. If the field is "LapNumber" and the summary type is "Max" the grid will show the total number of laps per run. In the case of Column or Row fields, this property indicates the type of summary for the row or column grand total. The following summary options are available:
-
Cell Format: This property allows values to be formatted using format strings
-
Sort Field: By default, all the rows and columns are sorted alphabetically. Sort Field allows a custom sort parameter to be defined.
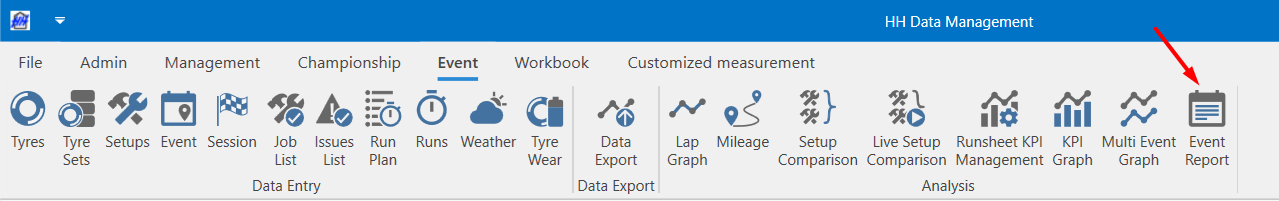
Event report viewer
The event report viewer can be accessed from the event tab of the ribbon bar:
A new display will appear in the ribbon bar:
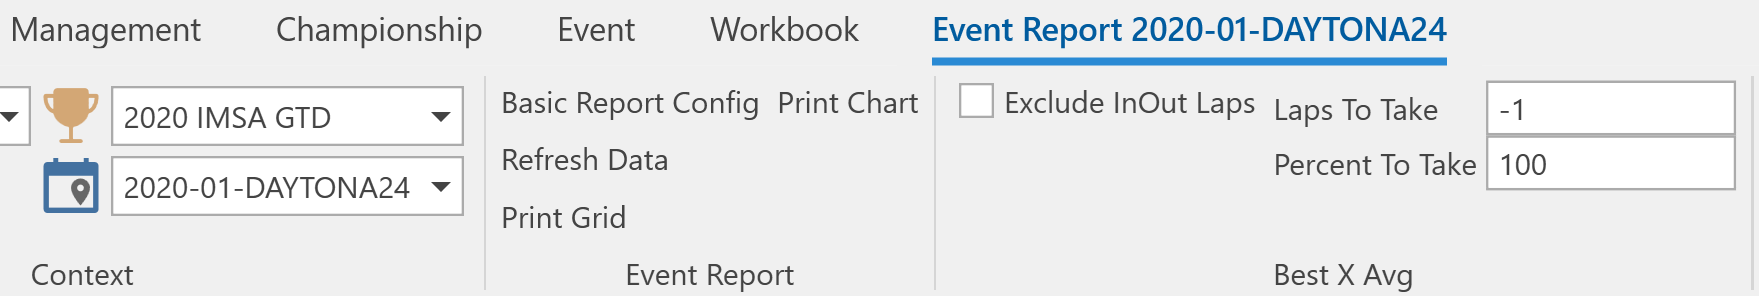
The ribbon bar contains the context selection for the report and additional options:
- Basic Report Config: Opens a pop-up window that allows the selection of row and column total calculation
- Refresh Data: force the recalculation of all the data fields
- Print: Print the desired control
- Exclude In/Out Laps: Exclude laps marked with "In", "Out", and "Out/In" from summary calculations
Specifically for the Best X and Best X Percent Summary:
- Laps To Take: Include only this quantity of laps
- Percent To Take: Include only this percent of laps
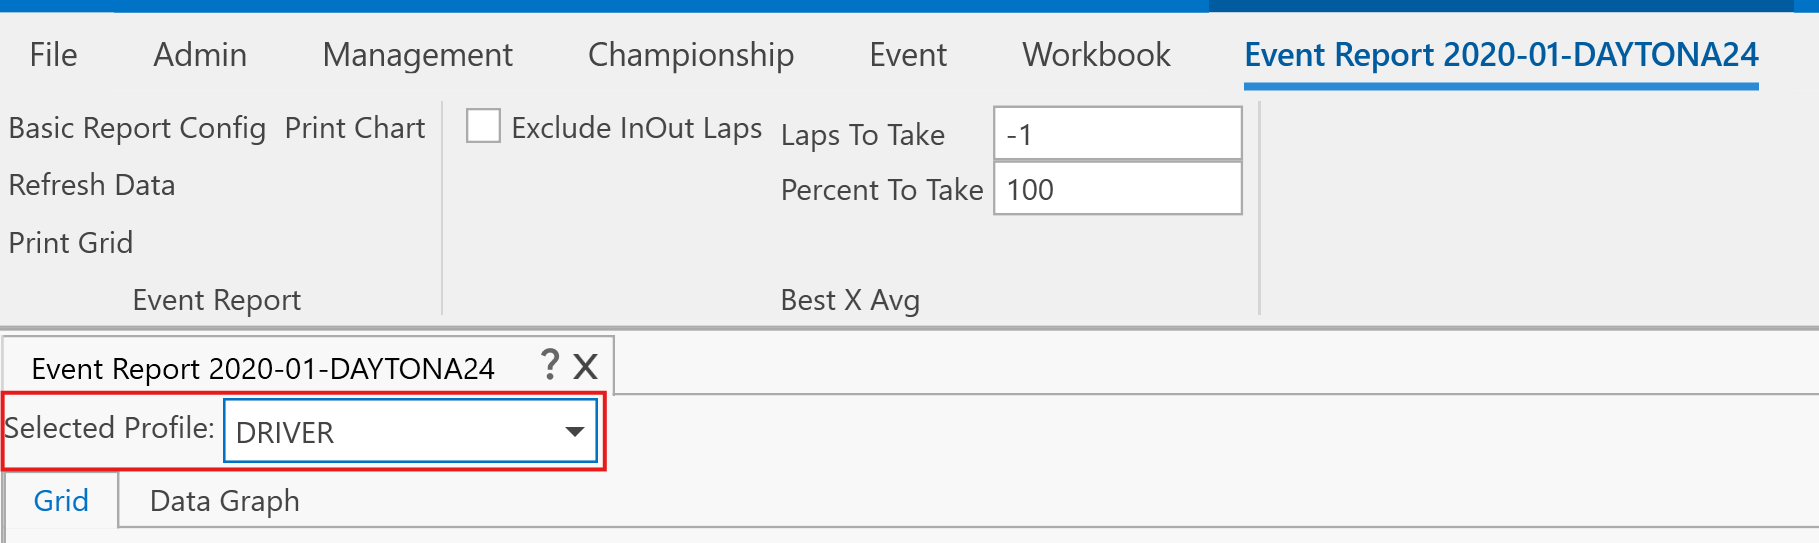
On top of the view, there is a combo box to select the desired report profile:
Event report table
The table shows all the data values in the pivot grid format. The field name for columns and rows are displayed. This control allows for some customization since it allows to drag and drop the fields.
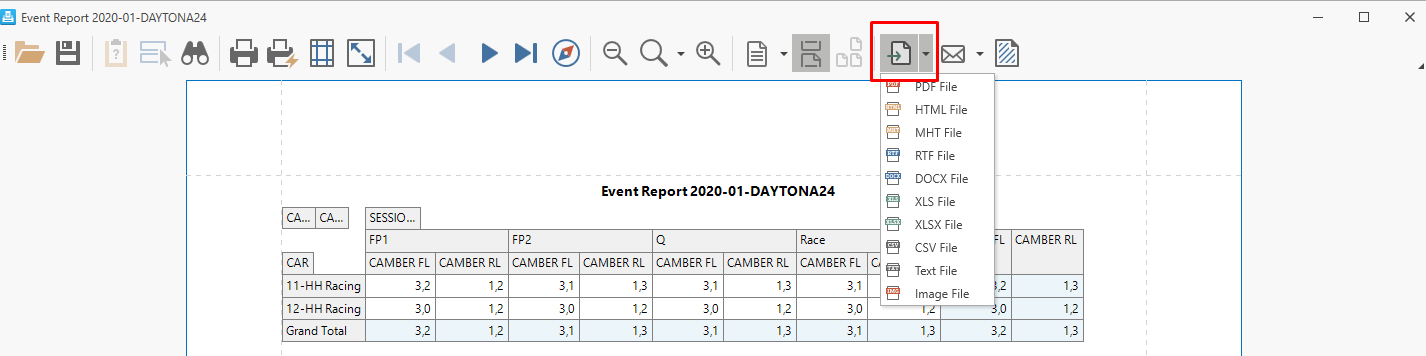
Export the table
The event report allows the user to print or export the data table to different formats such as .csv, .xlsx, .pdf. In order to access the export window click on Print Grid.

A new window will appear where you will be able to configure your print or export and select the file format.
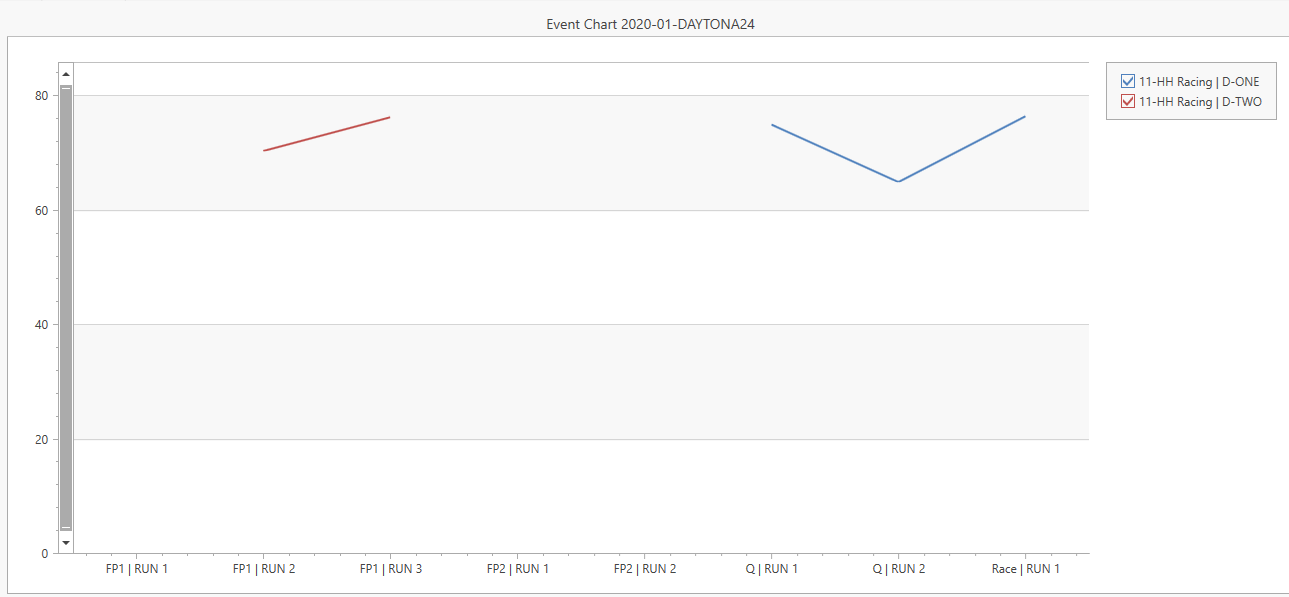
Event report graph
These controls show the data in a line graph. Each series corresponds to a data row in the grid