HH Data Management + Power BI
HH Data Management can be integrated with Power BI to create visualizations of large amounts of data by connecting it to the HH Data Management API.
This tutorial assumes a base knowledge of Power BI including installation, report creation and working with data sources. This example can be performed in both the Power BI web service, and the Power BI desktop application with minor differences.
The HH Data Management API provides several bulk endpoints for retrieving data en masse designed to be used with external data visualization tools such as Power BI.
Before attempting to use the bulk endpoints below, please review our general API documentation available on both our online help file, and Swagger documentation. These resources explain general API concepts and provide a test environment that can be used to become familiar with our API before exploring the more expensive requests that are found below.
The bulk endpoints available are as follows:
- Runs
https://hhdm-api.hh-dev.com/RunSheets/Bulk - Laps
https://hhdm-api.hh-dev.com/Laps/Bulk - Setups
https://hhdm-api.hh-dev.com/Setups/Bulk
All three endpoints accept the same query params:
| Key | Value | Required |
|---|---|---|
| accountId | Account ID | yes |
| eventIds | Comma-separated list of event IDs | yes |
| carIds | Comma-separated list of car IDs | no |
| parametersToInclude | Comma-separated list of parameters to return | yes |
| filter | Expression to evaluate on each entity (run/lap/setup) which returns a Boolean. The entity is only included in the response if the expression evaluates to true. | no |
While these endpoints are capable of querying large amounts of data at once, please be aware that the more events, cars, and parameters requested, the longer the response will take to return, and the higher the load will be on our cloud infrastructure which may result in errors.
As a result, it is even more critical to be selective in which parameters are included in the "parametersToInclude" list, this greatly affects the amount of data that will be returned and the wildcard * should never be used in conjunction with these endpoints.
Example
Now that we've established what endpoints are available and likely to be useful in a Power BI project let us see how this might be used.
In this example we will fetch all competitive laps from an event and display a lap graph similar to what can be done in HH Data Management with the main graph.
1. Getting and formatting the data
In a new or existing report select "Get data from another source":
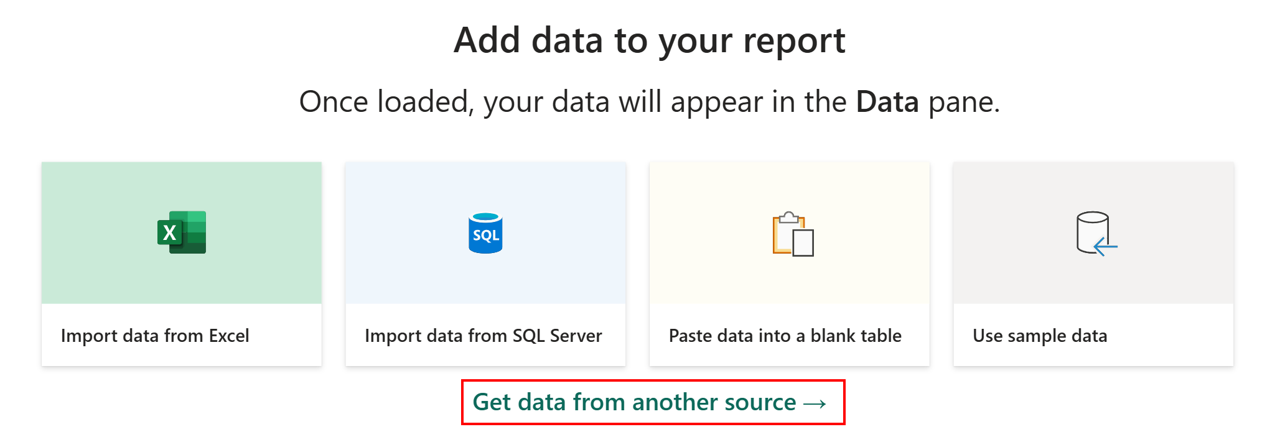
Choose "Other" → "Web" as the data source:
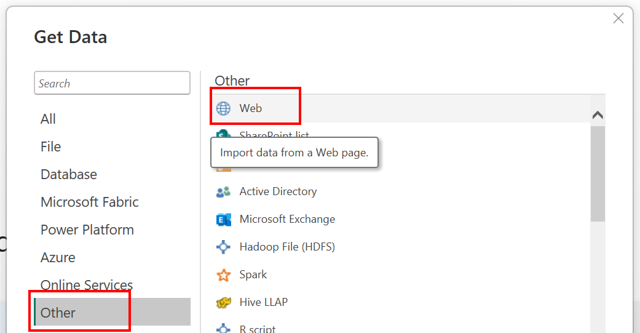
Select "Advanced" and supply the URL. Ensure you supply your API key and account ID in the headers:
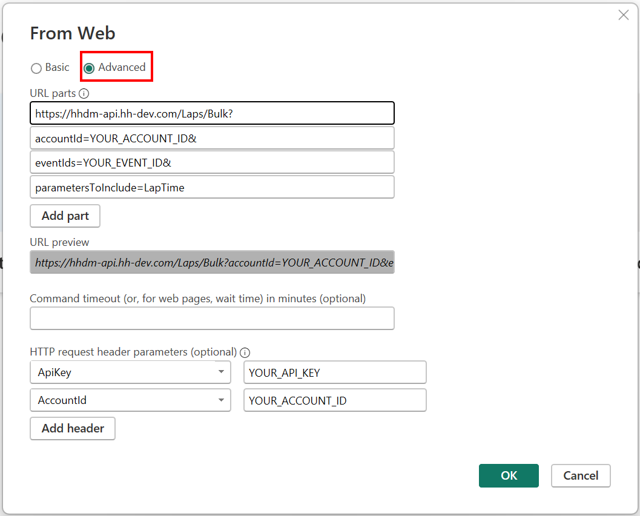
Click "OK" and you will be shown an automatically expanded query like the following:
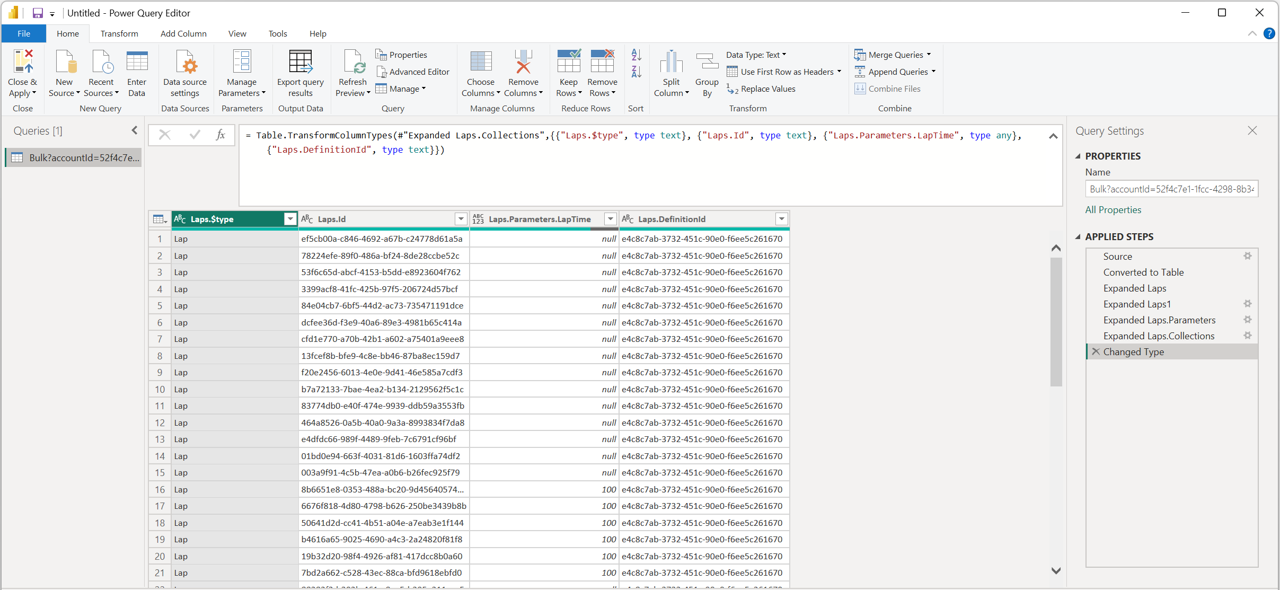
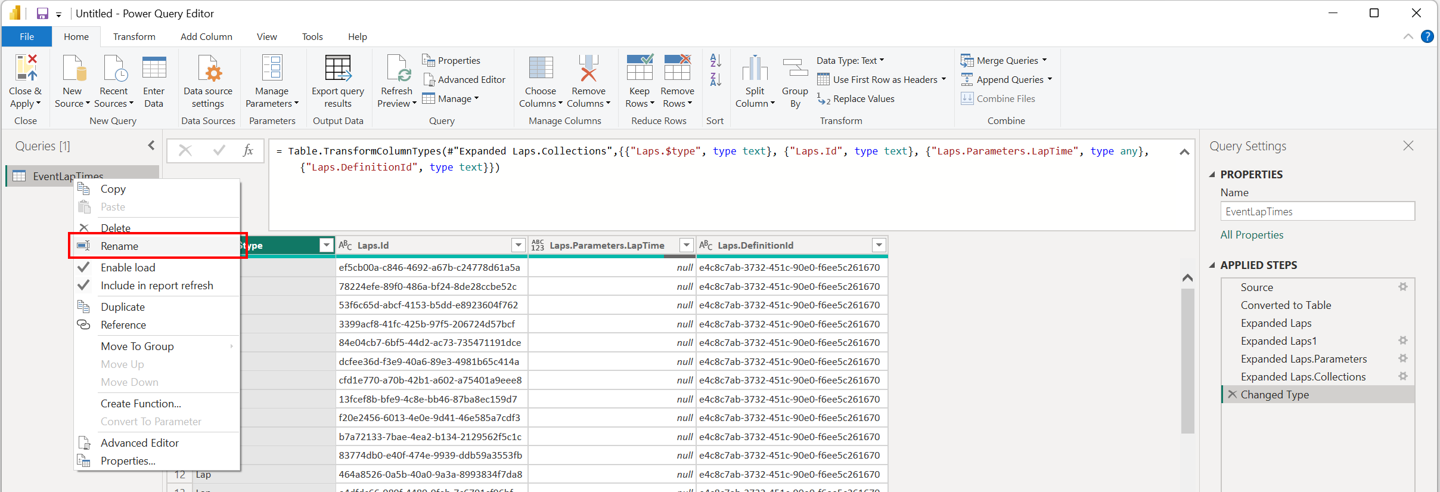
You can now rename this to something like "EventLapTimes" by right-clicking:
Notice a lot of the lap times are null in the output table, we can fix this by providing a filter expression to our API request. Start by clicking "Source" on the right and adding the following to the query editor:
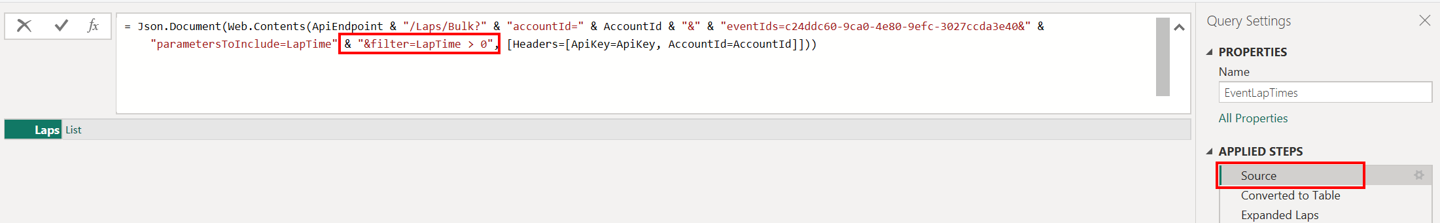
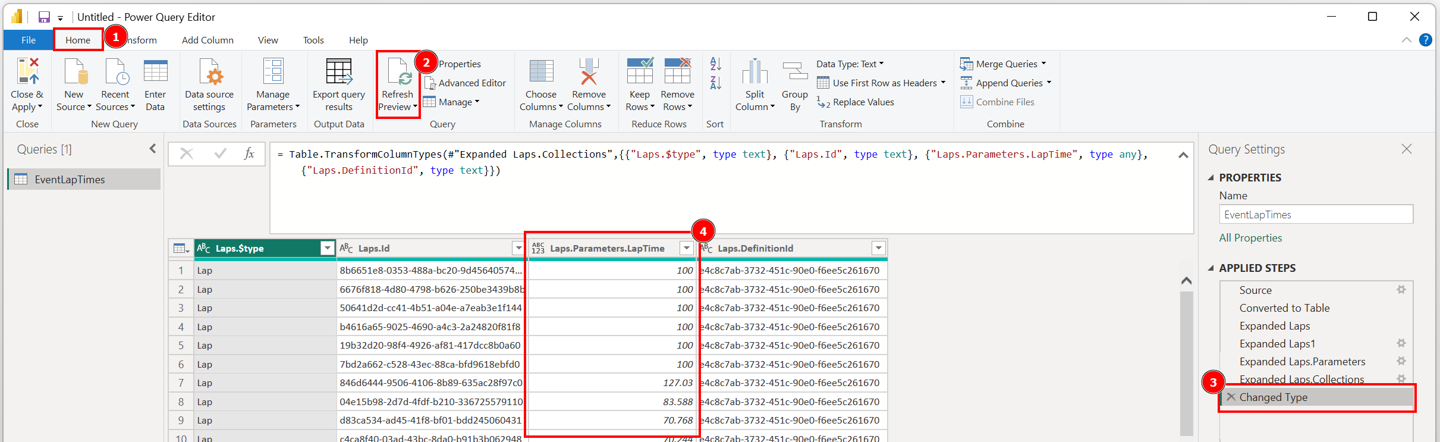
This will ask the API to only return laps with a non-zero lap time. We can refresh the preview of our data by clicking "Home" → "Refresh Preview". Then click on the last element in the "APPLIED STEPS" pane on the right to observe the new data:
We can also ask the API to return more information about the lap, such as the lap number. To do this, go back to the "Source" step and add TotalLaps to the "parametersToInclude":
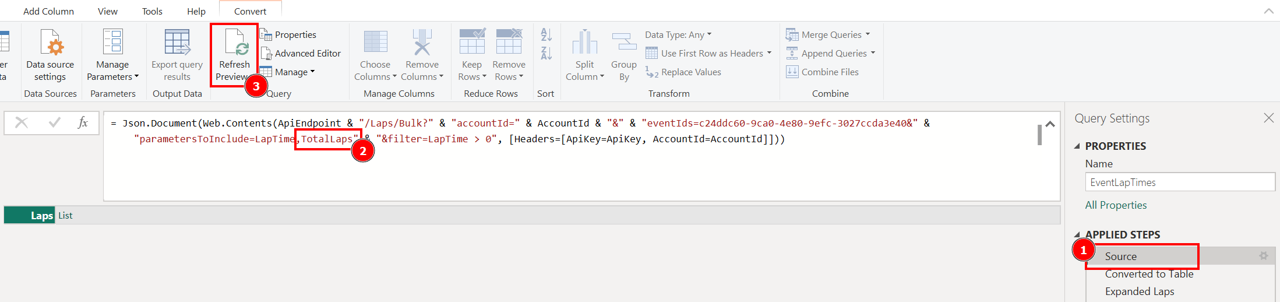
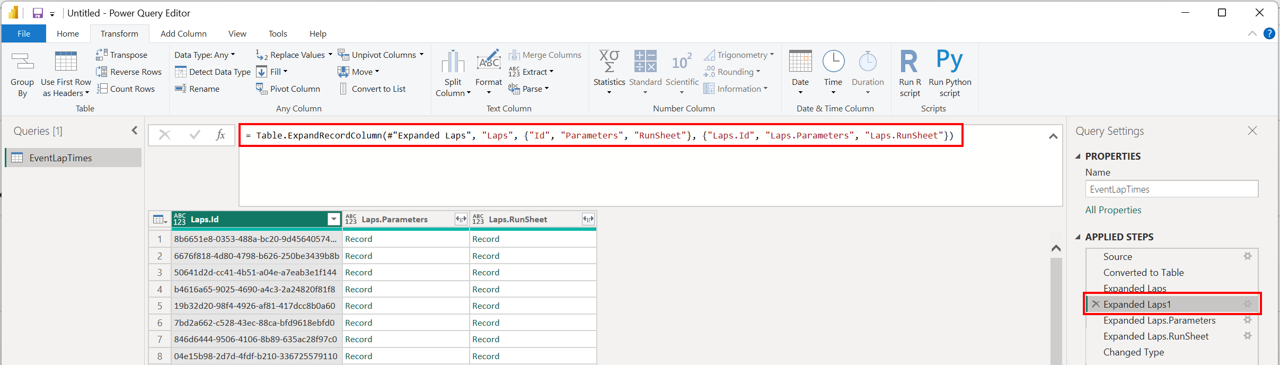
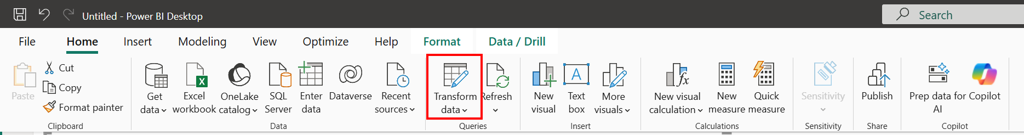
We can refresh the preview again to query the API again. But this time, you will see the final applied step not update to show the new parameter we asked for. To make our data source output this, we can edit the applied steps to include the TotalLaps parameter:
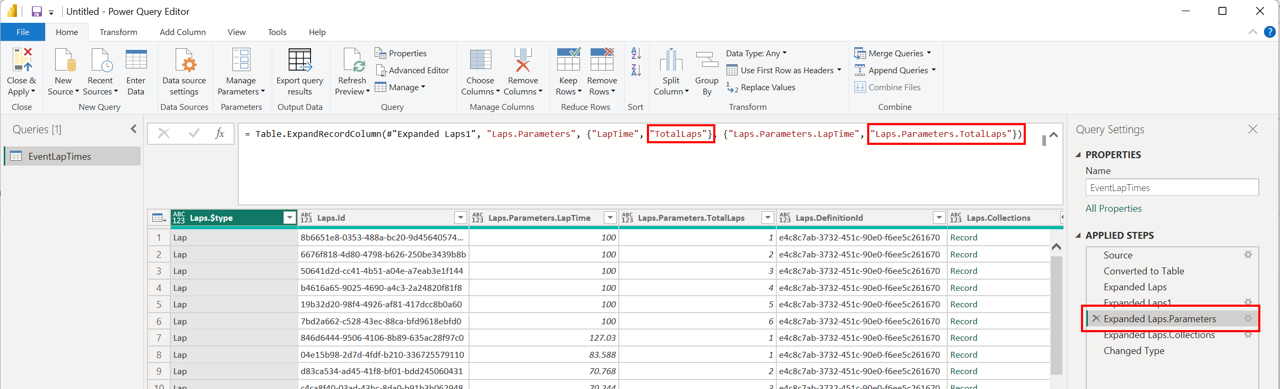
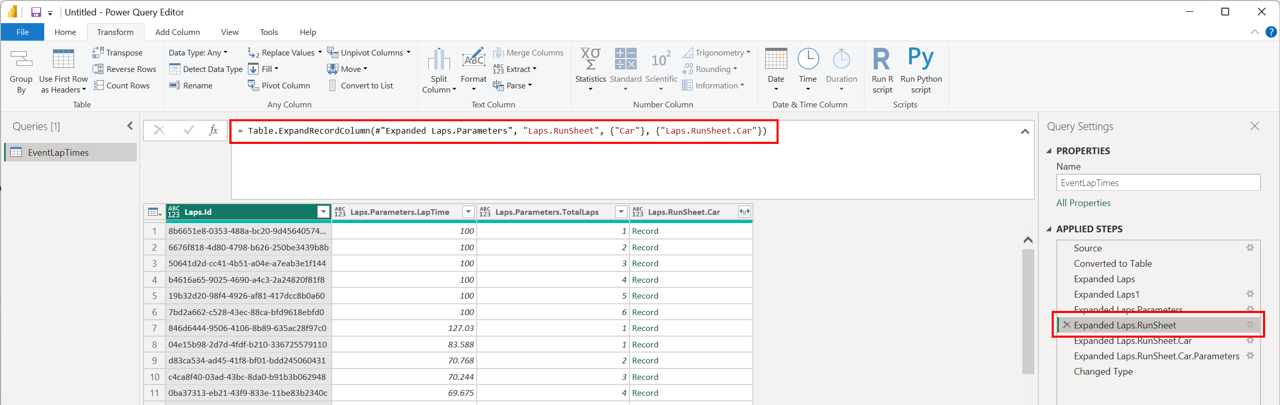
Notice in the above table, the TotalLaps column resets and does not increment forever. In this case, it is because in this event there are multiple cars, but our dataset can't tell this yet. To fix this we have a few options, the simplest of which is to just include the car number in each lap record. This is not the most efficient option, but for our primitive example it will suffice. To do this, add RunSheet.Car.Number to the "parametersToInclude". This is not returned in the normal "Parameters" object from the API, thus, we need to edit the applied steps to expand the new object:

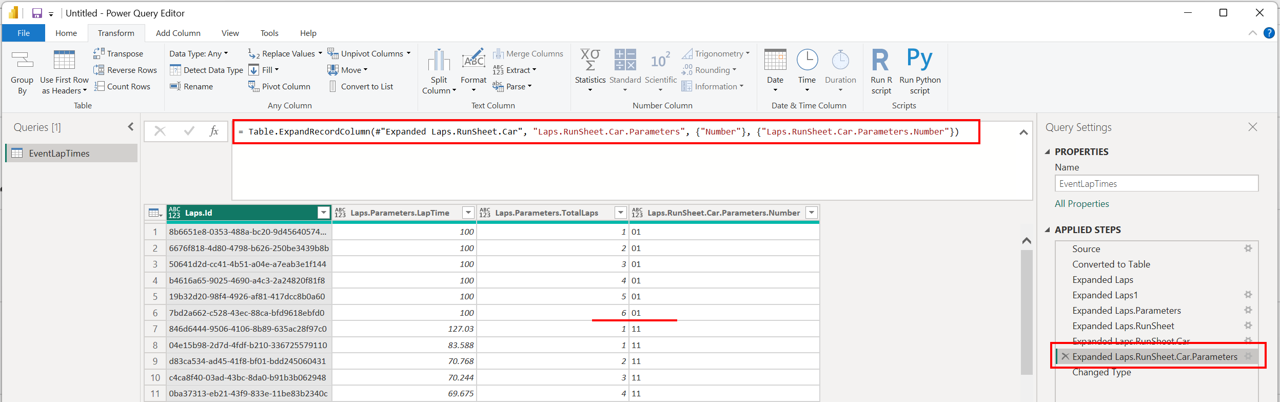
We can now see that the TotalLaps resets for the next car!
Finally we can clean up the column titles and properly type each one:

We are now ready to save our query and display it:
2. Displaying the data
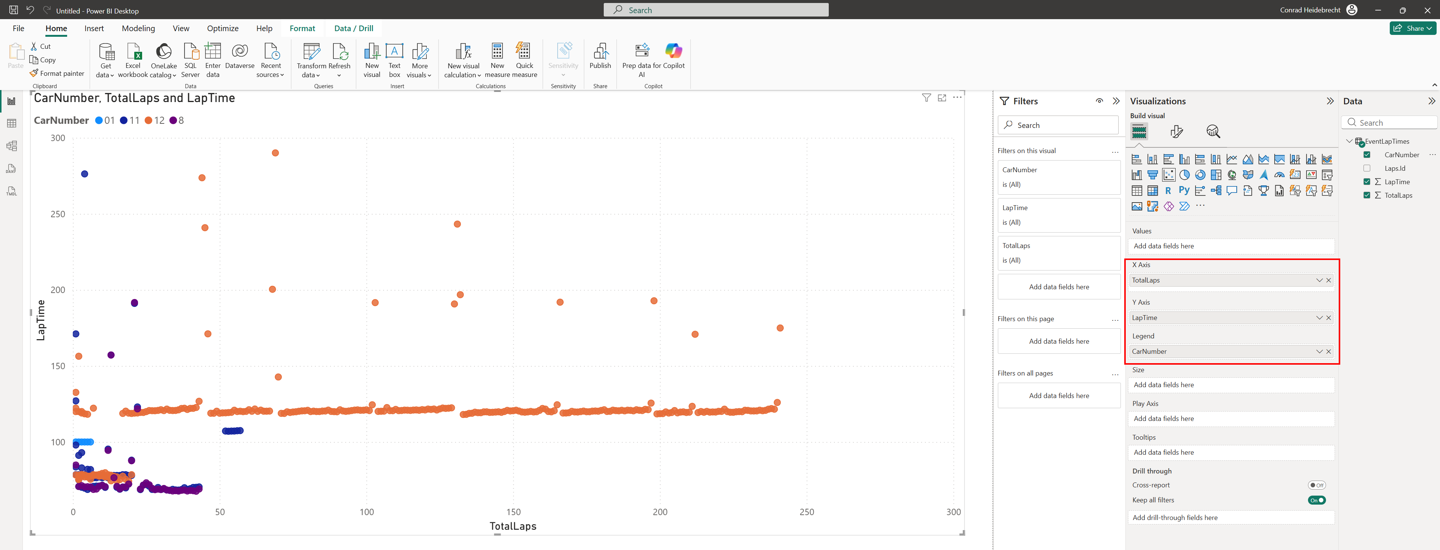
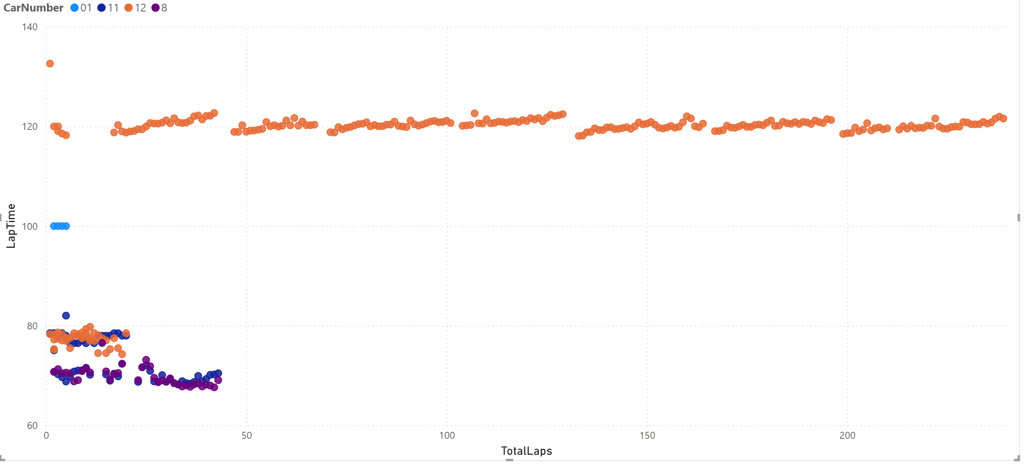
One example is a basic scatter plot of LapTime vs TotalLaps:
This is a good start, but the data is still very dirty. Power BI provides several powerful ways to filter data, but we can filter data right from the source using the filter expression in our API request. This has the advantage that we won't even download the data we don't need. Let's modify our request:
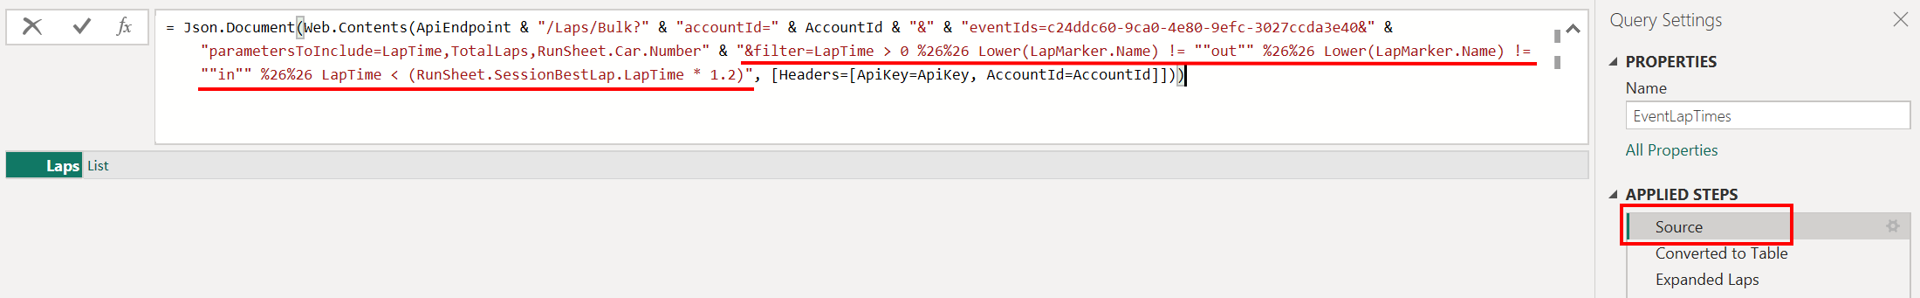
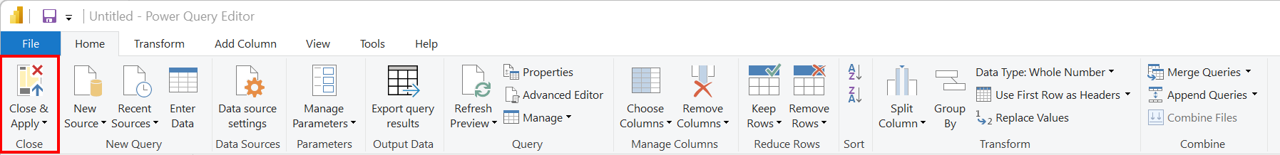
This will ask the API to skip over in/out laps and any lap with a lap time greater than 120% of the best lap time in the session. Click "Close & Apply" and a much cleaner graph can be seen:
3. Next steps
Far more powerful things can be done by combining the API with Power BI. For example, instead of supplying event IDs manually to the request, we can get the most recent events automatically by querying the /Championships endpoint and specifying Events.Name,Events.StartDate in the "parametersToInclude", filtering on that StartDate and then feeding the results from this query into the /Laps/Bulk endpoint we explored above.