Weather
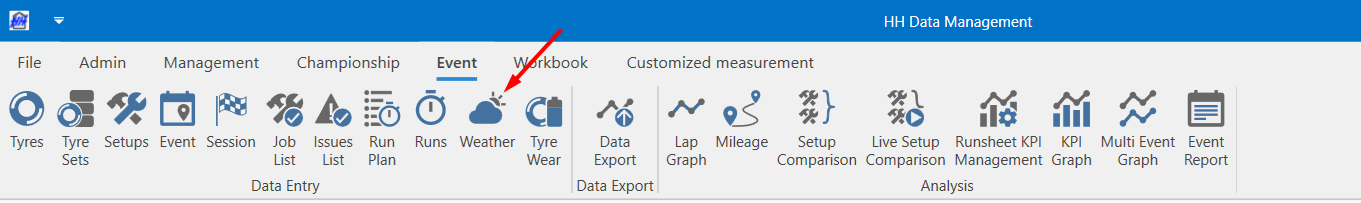
The weather view can be accessed from the event tab of the ribbon bar:
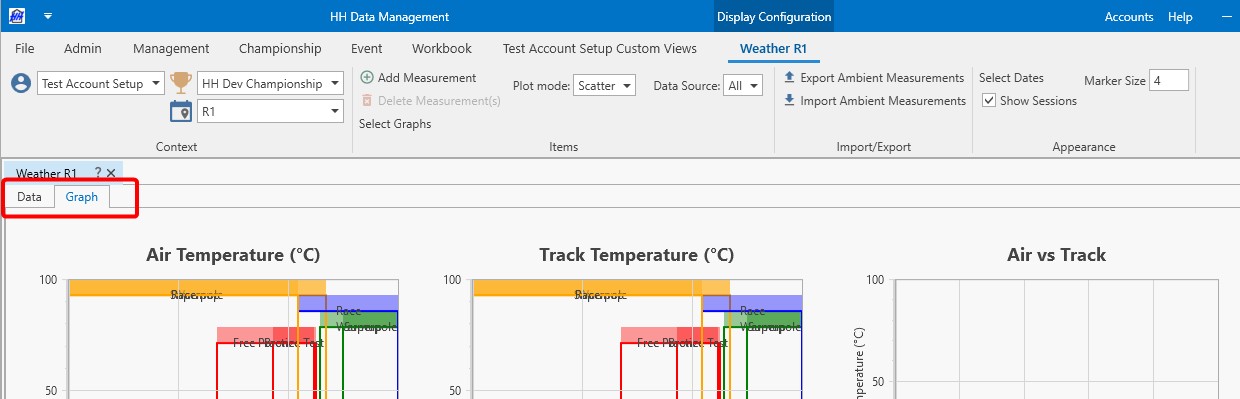
The weather worksheet contains two tabs:
Data
By default the parameters available in the weather worksheet are:
- Air Temperature
- Track Temperature
- Air Pressure
- Humidity
- Precipitation Level
- Precipitation Rate
- Wind Direction
- Wind Speed
Custom parameters can be added to the Ambient Measurement definition, which are then shown in the weather view.
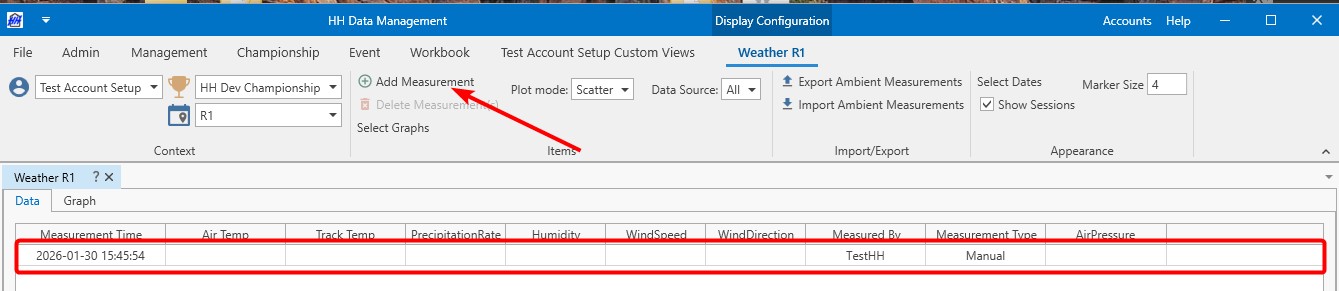
Add a measurement
A new measurement can be added by clicking on the Add Measurement button on the ribbon bar. A new line will appear at the end of the table with already the Measurement Time, Measured By and Measurement Type already filled. Then it can be populated with the desired data.
Delete a measurement
A measurement can be deleted by selecting a line and clicking on the Delete Measurement:
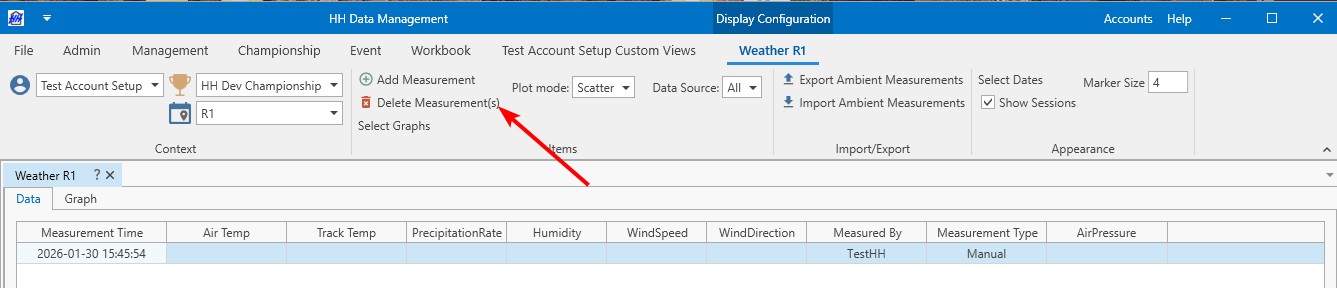
Holding CTRL while selecting rows allows multiple measurements to be selected for deletion at once. Holding Shift while selecting rows selects all measurements between the selected rows for deletion.
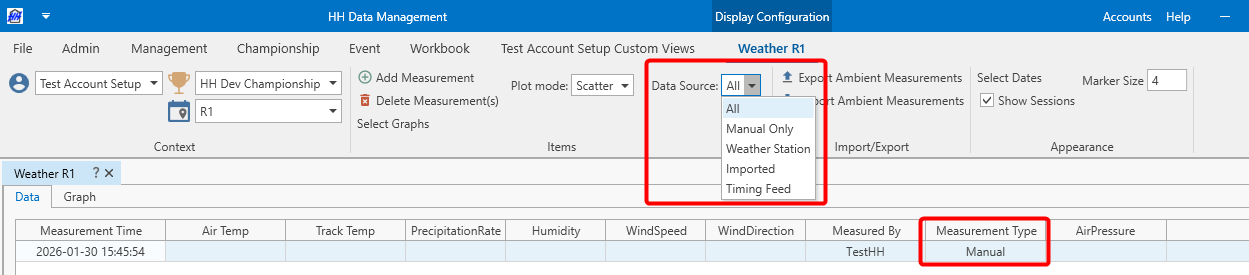
In addition to the measurement time and the parameters, information about who performed the measurement as well as if the measurement was done manually or with a direct link to a weather station is also displayed.
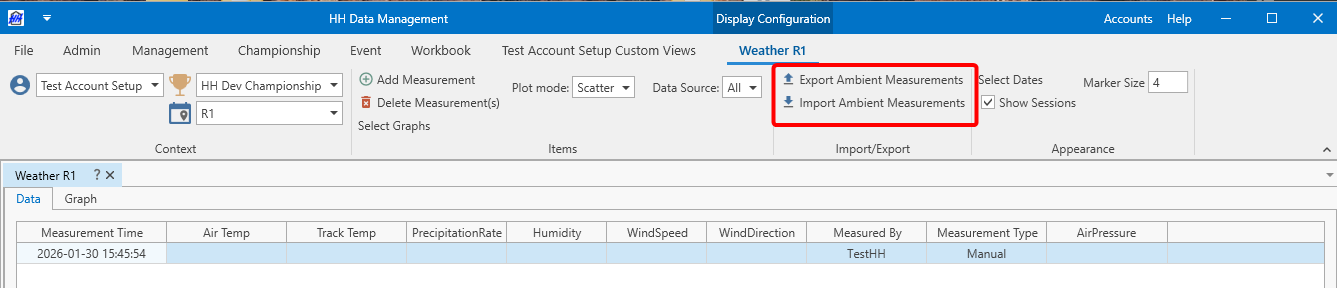
Importing and exporting measurements
Measurements can be exported to a CSV file using the "Export Ambient Measurements" button, and imported using the "Import Ambient Measurements" button in the ribbon bar:
The CSV has the following columns (in order):
- "Time"
- "AirTemperature"
- "TrackTemperature"
Followed by all double parameters specified on the Ambient Measurement definition ordered by parameter name. For example:
| Time | AirTemperature | TrackTemperature | AirPressure | Humidity | Precipitation | PrecipitationRate | WindDirection | WindSpeed |
|---|---|---|---|---|---|---|---|---|
| 12/13/2024 9:30 | 20 | 25 | 103.86 | 58.5 | 0 | 0 | ||
| 12/13/2024 10:00 | 20 | 26 | 103.86 | 58 | 0 | 0 |
Exported data can be filtered by measurement type and/or date using the data source combo-box and select dates button in the ribbon bar.
The best way to determine what format is required for importing new data is to export data from an existing event and observe the generated columns.
Importing data does not overwrite or modify any existing records. This means importing data that was previously exported will cause duplicate measurements to get created on the event.
Graph
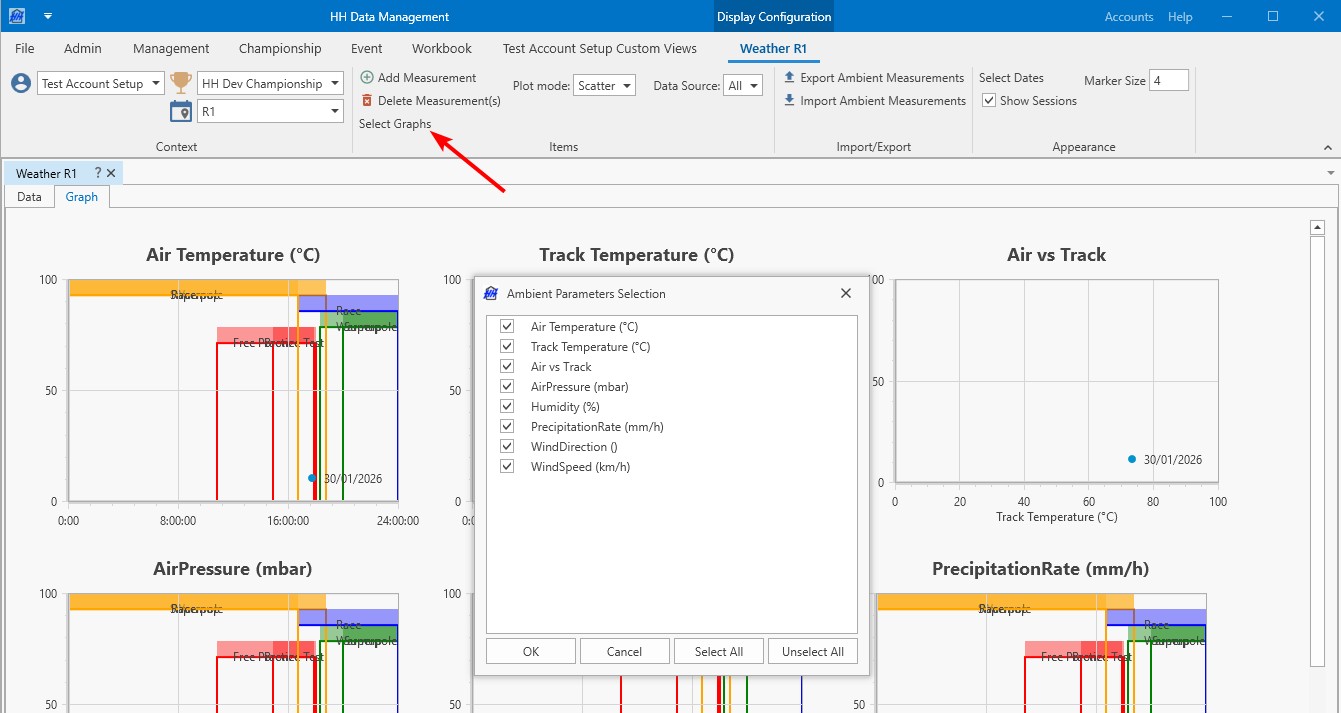
Select Graph
By clicking on Select Graphs, a selection window will be displayed to let the user choose the graphs to display.
The graph selection is saved in a layout. Make sure to save your layout after you make a change to the graph selection.
The selected graphs are then displayed on the screen:
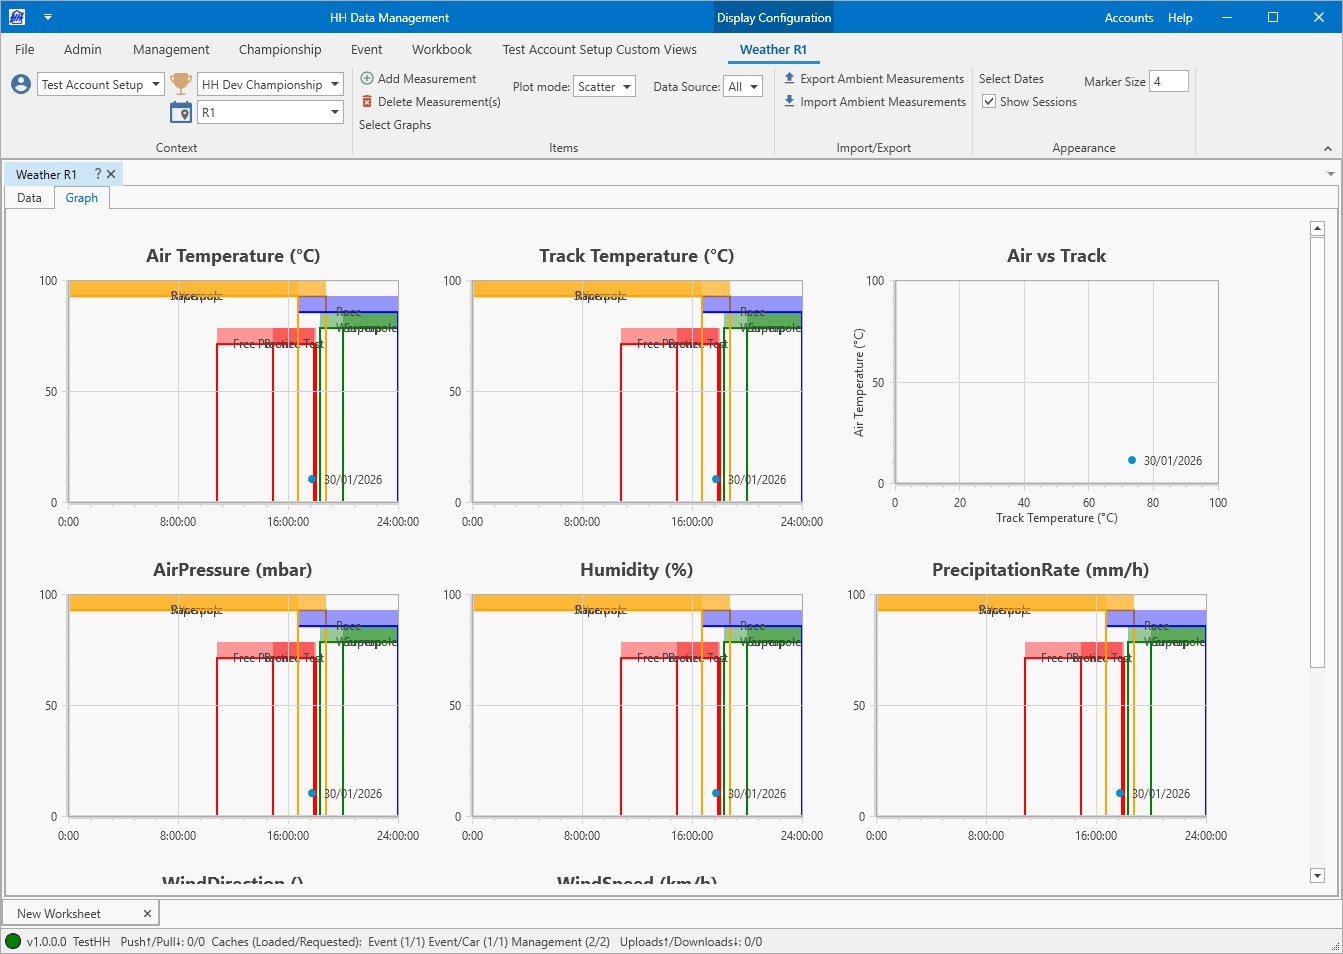
Each line colour represents a day and is associated with the colour of the session legend at the top of the graph.
Plot Mode
There are 3 different types of Plot mode that can be selected via a combo-box in the ribbon bar:
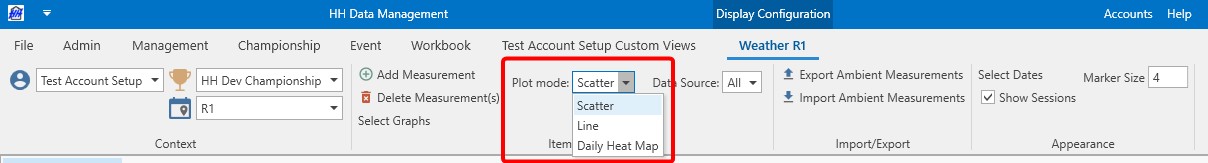
The Daily Heat Map represents the data parameters organised per day using conditional formatting. The conditional formatting is a heat map from the lowest to the highest value for each parameter:

Data Source
Data can be filtered by selecting which measurement type to display using the Data source combo-box in the ribbon bar:
Hiding Sessions From Weather Graphs
Selected session labels can be excluded from weather graphs. The weather data points will still be displayed, but the session labels will not be shown on the graphs when Show Sessions is selected. To exclude one or more sessions from the weather graphs:
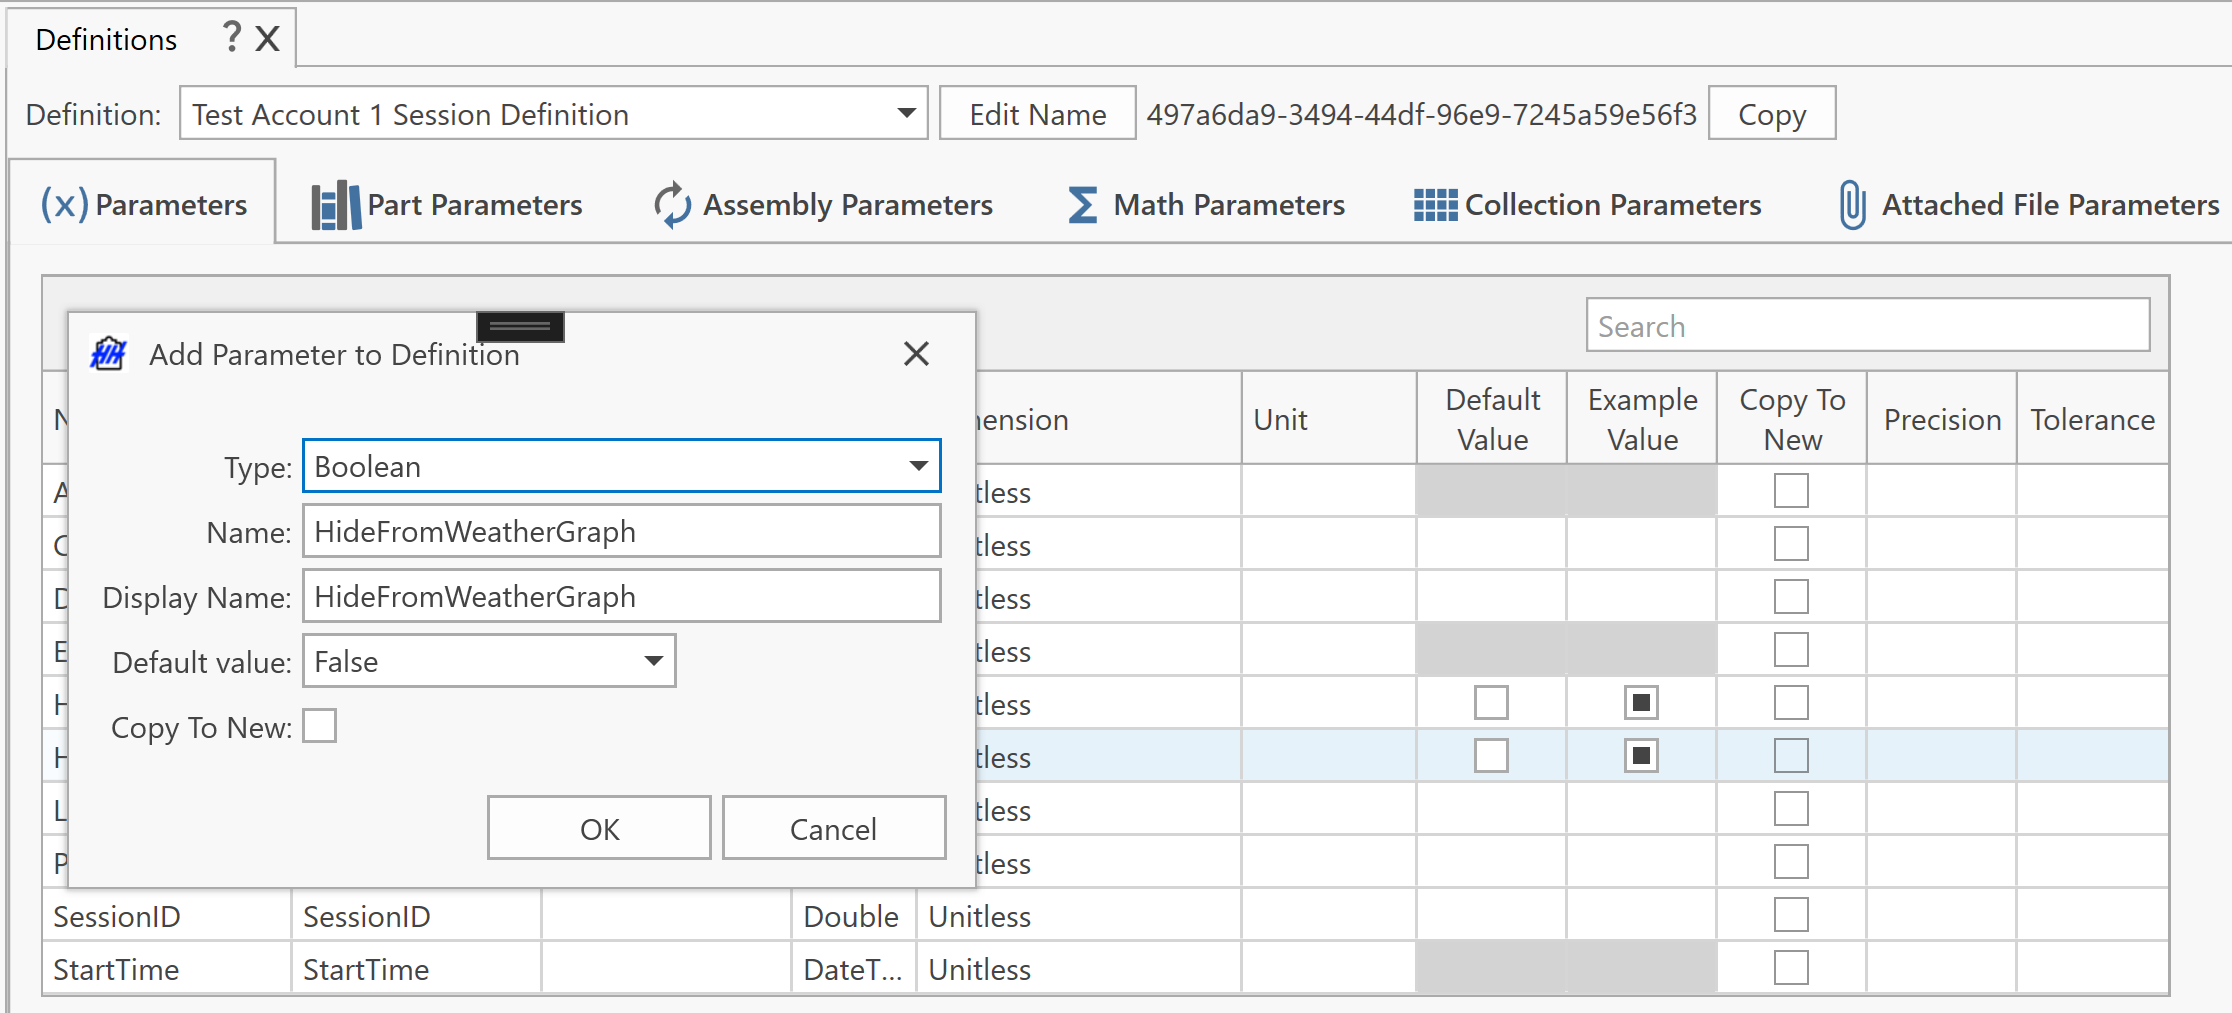
- On the Definitions page, add a boolean property to the Session definition: HideFromWeatherGraph.
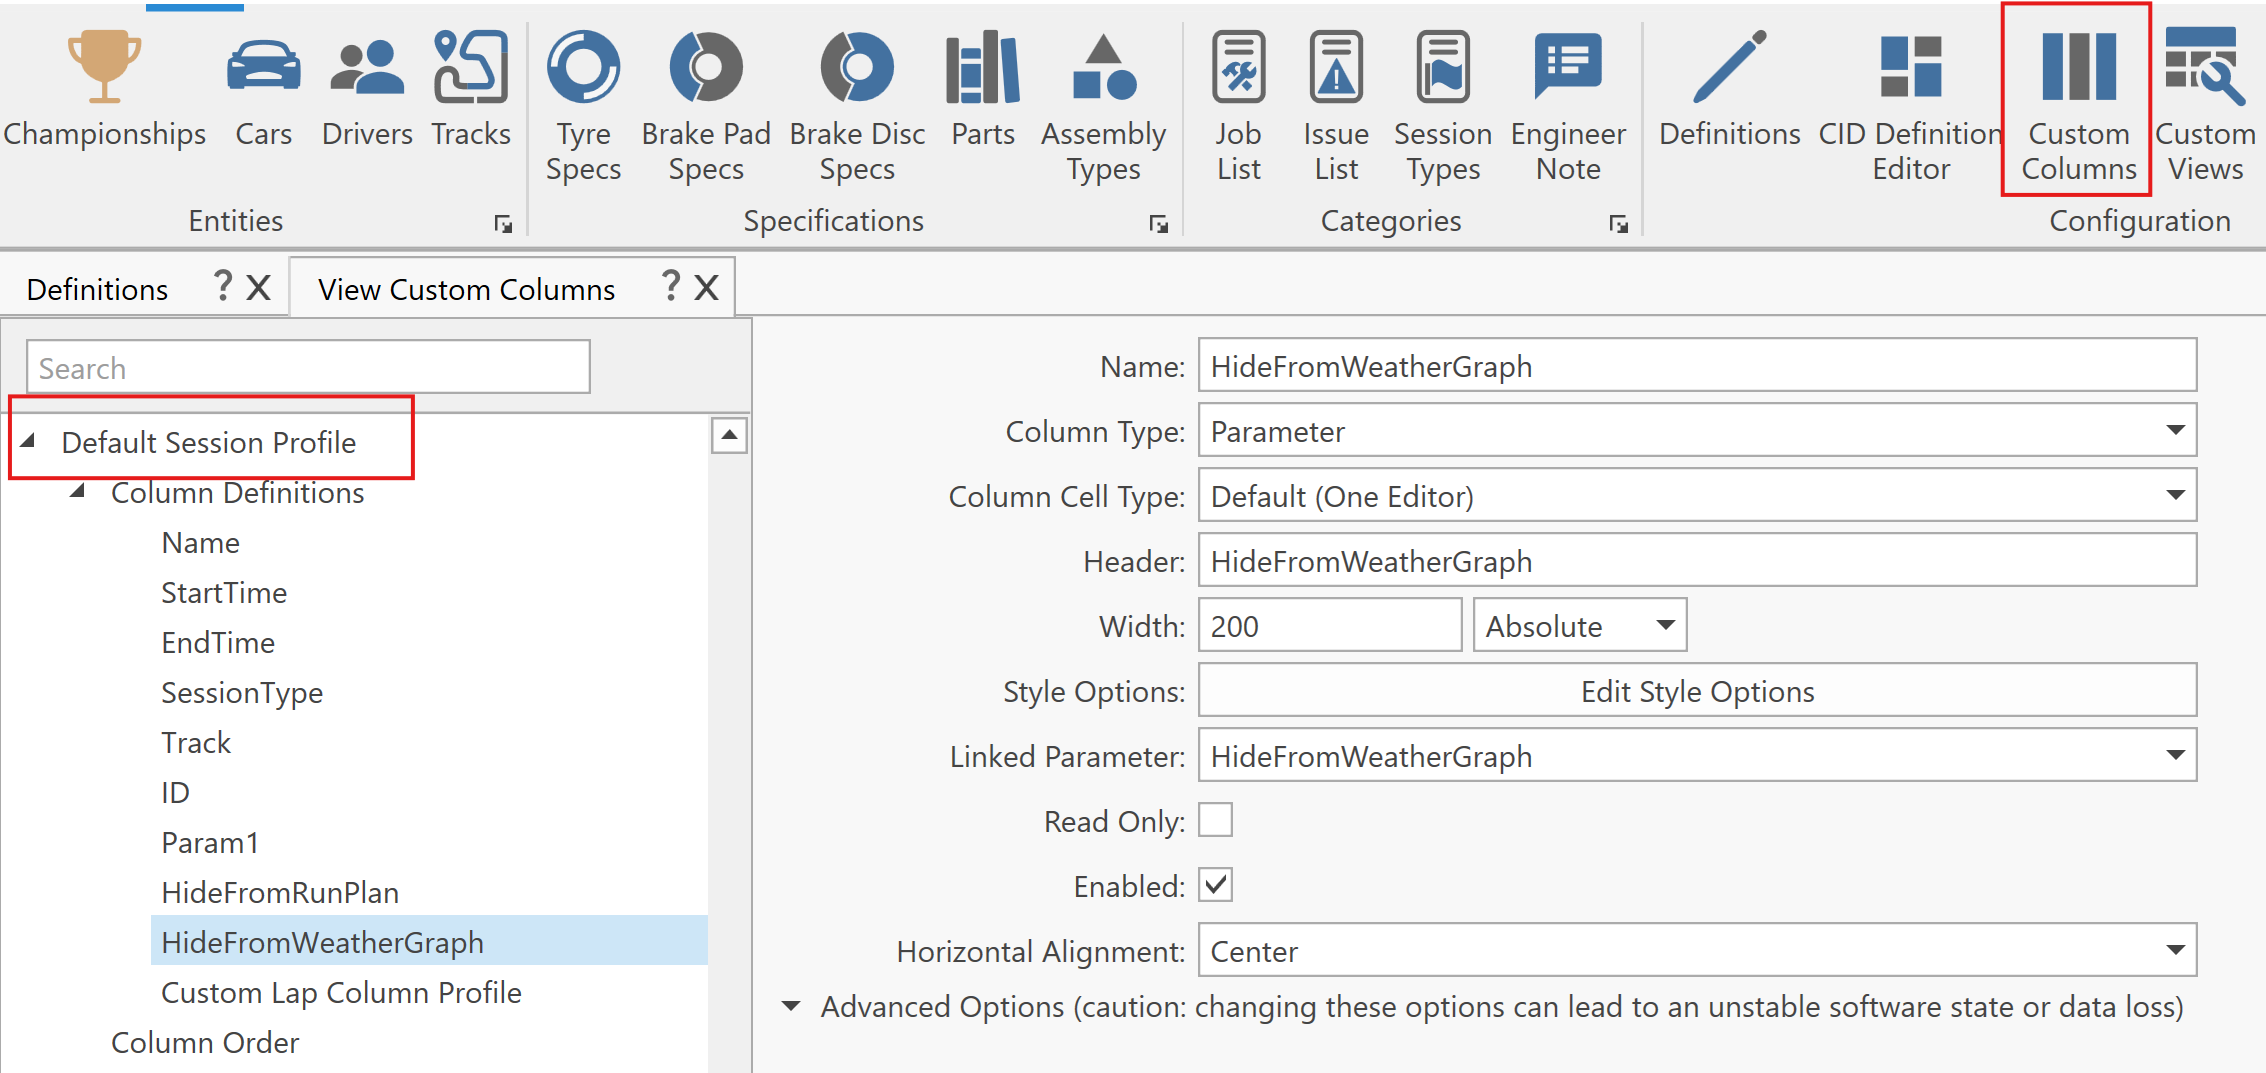
- On the Custom Columns page, add the column to the Default Session Profile for the new property, and ensure that it is enabled.
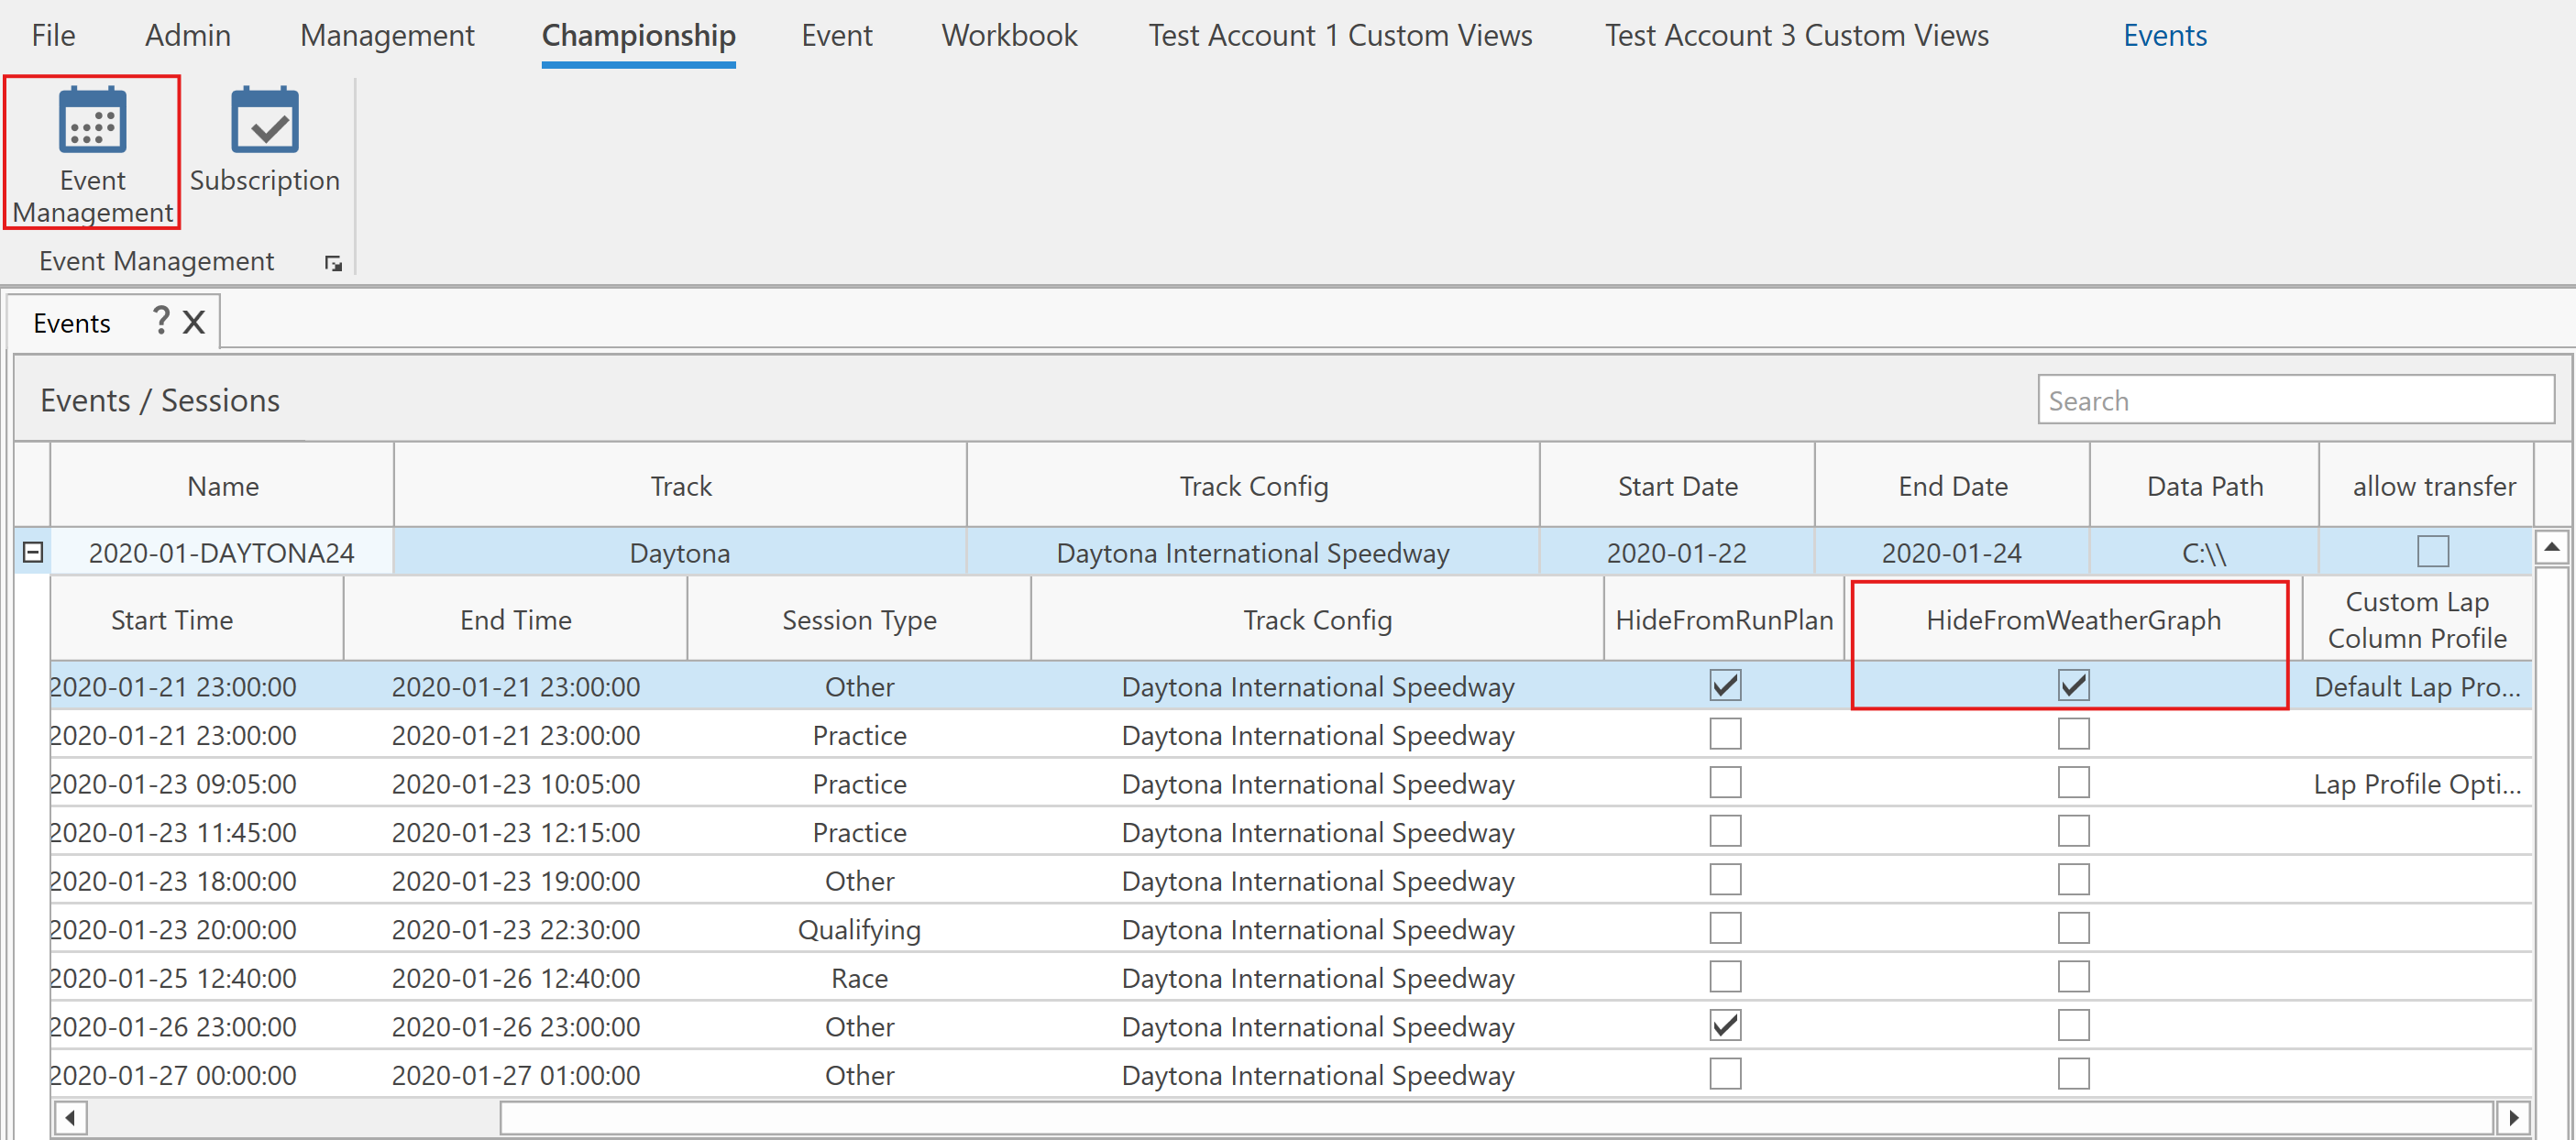
- On the Event Management page, there will now be a column for the property. Set the property to "true" for each session to be excluded from weather graphs.
Appearance
The appearance of the graphs can be customized in three ways using the appropriate section on the ribbon bar:
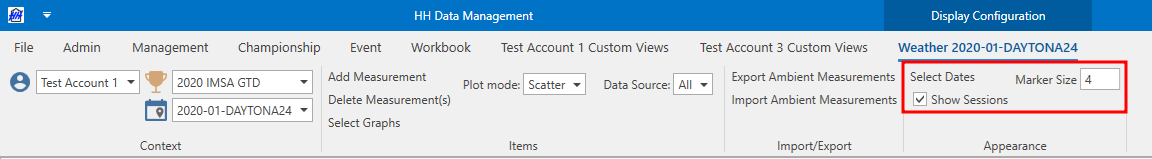
- Select Dates Enables only measurements taken from certain days to be displayed
- Show Sessions Enables and disables the session overlays
- Marker Size Configures the size of each data point displayed
Linking to runs
Ambient measurements recorded in this view can auto-populate the corresponding ambient conditions on the runsheet by completing the following steps:
-
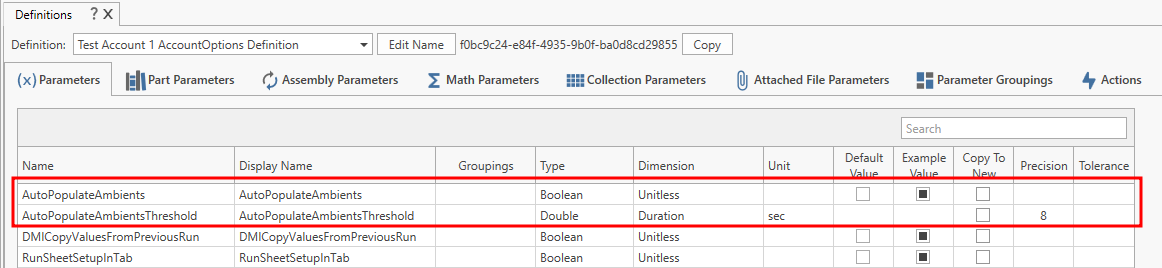
Go to Definitions and create 2 parameters on the AccountOptions definition:
- AutoPopulateAmbients (Boolean): this enables and disables the feature
- AutoPopulateAmbientsThreshold (Duration): this can be specified in either minutes or seconds by selecting the unit when creating the parameter
-
Restart HH Data Management
-
Go to the backstage options and set the options created in step 1:
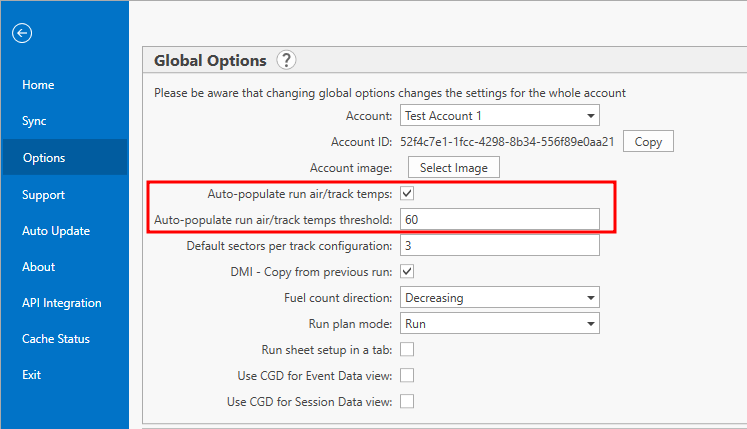
Now when an ambient measurement is added or recorded HH Data Management will go through each run sheet and find the measurement closest to the start time of the run. If the difference between this measurement time and the run start time is less than or equal to the threshold value, the ambient conditions of the run are populated with the measurement data. If no threshold value is defined but the feature is enabled, HH Data Management defaults to using 120 seconds as the threshold value.